
Exchanging Places: Stop Betting - Own the House
–Financial Exchanges as the cornerstone of global capital markets


In Casablanca, Rick’s café is the place where everyone meets.
Spies, soldiers, refugees, collaborators—winners and losers on all sides of the war. They argue, negotiate, bluff, and scheme. Allegiances shift. Outcomes are uncertain. But while the world outside convulses, Rick’s café remains open. Drinks are poured. Information is exchanged.
With that as a grounding metaphor, turning our attention to financial markets it’s prudent to ask
‘ Who gets paid regardless of what happens in the world?

Hugo Navarro · Benjamin Demase
Most investors focus on predicting which assets will outperform and how political shifts will affect markets. What policy changes might alter the trajectory of prices. These views evolve constantly, driven by headlines and sentiment. Capital reallocates. Winners and losers rotate. These debates shift with every headline and as participants and positions rotate, fortunes are made and lost.
But the venue doesn’t change.
Every trade, regardless of intent or result, passes through an exchange. Capital changes hands. Positions are opened and closed. Volatility rises and falls. And through it all, the exchange collects its fee—indifferent to who was right, only that activity occurred.
This paper is about those venues. About exchanges as the permanent meeting place of capital, where bulls and bears, hedgers and speculators, locals and foreigners all transact under the same roof. Exchanges don’t try to predict direction but rather they monetise volume. In a world fixated on picking winners, exchanges quietly profit from ensuring the game never stops.
Every transaction, profitable or not, results in revenue for the exchange.
Before we dive into today’s deep-dive, I’d like to introduce my collaborator, Hugo Navarro of Undervalued and Undercovered. Hugo specializes in uncovering overlooked cyclicals and under-the-radar small-cap opportunities, applying a disciplined value investing framework. His sharp eye for asymmetric setups has driven a 70% return in his model portfolio in just a year. If you find this analysis insightful, I highly recommend subscribing to Hugo’s research—especially if you’re looking for deep, fundamental work that the market hasn’t fully priced in.

And make sure to leave a like and a restack! If we reach 60 likes and 25 restacks, we’ll team up again and record a podcast about exchanges.
A Brief History of Exchanges — Adapting, Not Disappearing
The impulse to create organized venues for trading claims on future cash flows is ancient. In Rome around 1 BC, the fora hosted trading in publicani—shares in tax farming operations where private consortiums bid for the right to collect provincial taxes. These were tradable interests with defined revenue streams, bought and sold in public spaces where price discovery occurred through open outcry. The fall of Rome and the subsequent contraction of long-distance commerce made such formalized trading dormant for centuries.
The revival came with the Italian city-states. Between the 12th and 16th centuries, Genoa, Venice, and Florence developed organized markets where government debt instruments, primarily bonds issued to finance wars and expeditions, could be traded. These were the original secondary bond markets. They provided liquidity for claims that had already been issued. The Venetian prestiti traded at discounts or premiums based on the Republic’s perceived creditworthiness, establishing the principle that securities have market-determined prices distinct from their face value.
However, the first recognizable stock exchange, where equity ownership in a company could be traded, was formed by the very inventors of the company structure itself.
The Amsterdam Stock Exchange was established in 1602 by the Dutch East India Company (VOC) which, not coincidentally, was the first joint-stock company formed in history.
Necessity being the mother of invention, the VOC needed a place which provided liquidity for shareholders who wanted to trade their positions. This provides an important insight: exchanges exist to monetize the secondary consequences of capital formation in addition to capital formation itself.
By 1688, there were an estimated 360 companies trading on the Amsterdam exchange, with impressive trading volumes given the absence of the internet. The London Stock Exchange formalized in 1801, though trading shares had occurred in London’s coffeehouses since the 1690s. The New York Stock Exchange was founded in 1792 under a buttonwood tree on Wall Street, initially trading just five securities. Today that number stands closer to 2,300.
The initial template established by these institutions: a recognised venue, standardized trading hours, membership requirements, and the ability to charge for access to liquidity has proven adaptable and has survived across radically different political, technological, and economic contexts as the reader is about to discover.
Wars and Political Collapse
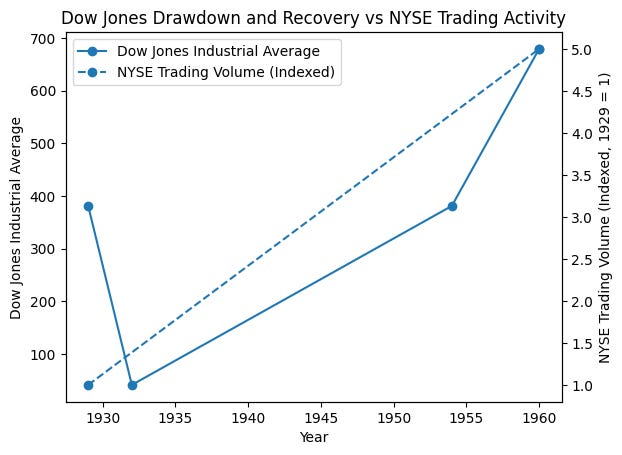
During the Napoleonic Wars (1803–1815), European exchanges remained operational even as governments fell and reformed. The London Stock Exchange stayed open throughout both World Wars.1 The NYSE actually saw increased trading volume during WW1 despite the exchange experiencing its longest closure ever from July 31, 1914 to April 1, 1915.2 Amazingly, by 1929 the daily trading volume had risen more than tenfold from pre-war levels.3
Hyperinflation and Currency Collapse
The Weimar hyperinflation (1921–1923) destroyed the German mark where at its peak, prices doubled every 3.7 days.4 Yet the Berlin Stock Exchange remained open and liquid throughout. Traders simply re-priced securities in gold marks, then Rentenmarks, then Reichsmarks. The mechanism adapted and continued to provide its essential function.5
When the ‘Bretton Woods standard’ collapsed in 1971, exchanges didn’t contract but rather they expanded and enjoyed a host of new offerings. Currency volatility created demand for new instruments (futures, options, swaps), and exchanges provided the infrastructure upon which they traded. The Chicago Mercantile Exchange (CME) launched currency futures in 1972.6 By 1980, financial futures exceeded agricultural commodities in trading volume.7
The Great Depression and Regulatory Transformation
The 1929 crash represents perhaps the most severe stress test. U.S. stock market capitalisation fell 89% peak-to-trough (1929–1932).8 Many companies disappeared. Yet exchanges survived and emerged with enhanced structural authority.
The Securities Acts of 1933 and 1934 didn’t disintermediate exchanges; they formalised their role as gatekeepers.9 The SEC effectively granted exchanges the status of self-regulatory organizations. An existential threat became a moat: listing requirements, disclosure obligations, and trading surveillance became the services exchanges provided and charged for.
Whilst it took the Dow until 1954 to fully recover to its prior 1929 high, the NYSE trading volume in 1960 was five times what it had been in 1929.10
Technological Revolutions: From Pits to Packets
Trading the tape (1867)
With the advent of the stock ticker, transmitting of prices over telegraph lines, came the fear of a threat to the business model of the exchange trading floor as the ticker enabled price discovery outside the physical exchange and could theoretically have decentralized trading.11 Instead of disruption, exchanges monopolized ticker access, charging for real-time data feeds. The technology that threatened to disintermediate became a new revenue stream. This is a pattern that would repeat.
Electronic Trading (1971–2000)
The NASDAQ launched in 1971 as the first electronic stock market without a physical trading floor.12 Here was another threat supposed to render traditional exchanges obsolete. Instead, it forced modernisation and revealed that exchange value resided not in the trading floor but in the network effect of liquidity. By the 1990s, most exchanges had hybrid models and trading volumes exploded: average daily NYSE volume grew from 11 million shares in 1970 to 1 billion by 2000 or a 90x increase in 30 years.13
High-Frequency Trading and Fragmentation (2000–Present)
Regulation NMS (2005) fragmented the U.S. market, enabling alternative trading venues and dark pools.14 Critics predicted the death of traditional exchanges. Instead, exchanges simply adapted and became more insulated, selling speed itself via co-location services, direct market access, and proprietary data feeds.
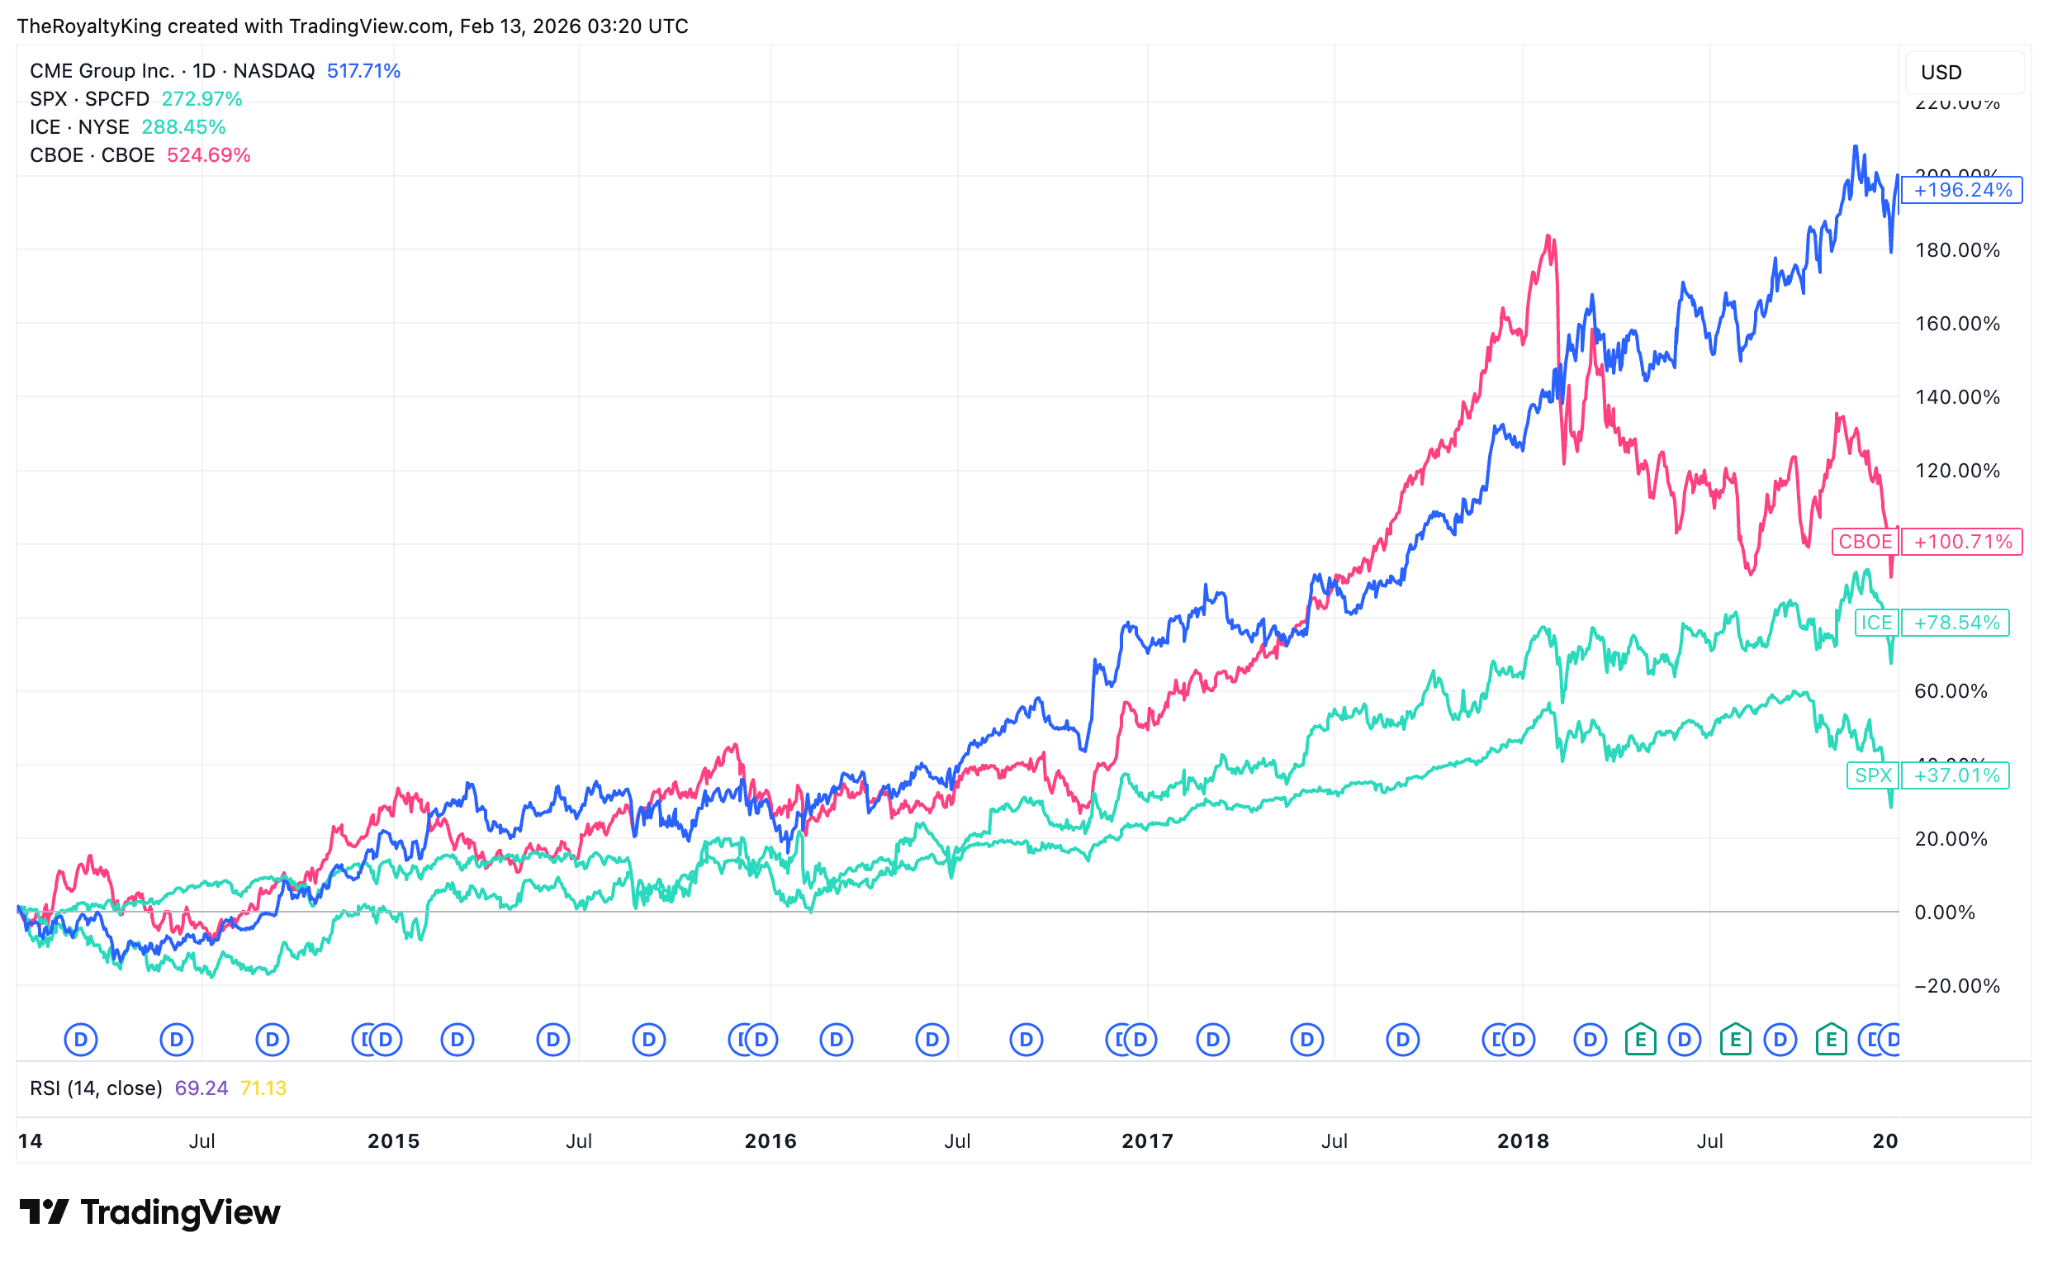
ICE acquired the NYSE in 2013 for $8.2 billion.15 CME Group’s market capitalization exceeded $60 billion by 2021.16 Exchanges have thus far embodied the concept of anti-fragility given they thrive on volatility and seem to gain from noxious stimuli meant to hurt them.
The Recurring Pattern: Disruption as Revenue Opportunity
What emerges across four centuries is a consistent dynamic: exchanges invariably benefit from disruption. They don’t produce assets as such; they monetize the infrastructure required to trade them and the birth of every new asset class usually brings with it a whole host of associated new derivative products to trade. Much like every barrel of oil produced in the Permian basin brings with it 4 barrels of produced water, every new asset class listed on an exchange has the potential to bring 4 or more new tradable products such as: options, futures, futures options, ETFs and derivatives on the ETF. When new technologies threaten trading methods, exchanges either acquire the technology or replicate its functionality.
Unlike banks (which take principal risk) or brokers (disintermediated by technology), exchanges operate two-sided networks where liquidity begets liquidity. As long as markets exist, the institution aggregating liquidity extracts rent from that aggregation.
The insight for investors: you’re not betting on specific products, technologies, or geographies. You’re betting on the persistence of price discovery as a service worth paying for which as we’ve seen is a service that has survived every economic, political, and technological regime change in modern history, emerging from each disruption with higher volumes and broader product sets.
Markets mutated and exchanges monetized the mutation.
Exchanges, Participants & A New Term ‘Structural Alpha’
The structural asymmetry between direct market participants and those who own said market creates a category of investment that is qualitatively superior across economic cycles.
The Participant’s Dilemma: Directional, Cyclical, Fragile
Most market participants, be they retail individuals or institutions, share a common vulnerability: they must be right about direction. A long equity position requires the market to rise. A short position requires it to fall. A commodity trader needs to correctly anticipate supply, demand, geopolitics, and weather patterns. Even the most sophisticated quantitative strategies are fundamentally directional bets on statistical relationships holding to allow ‘mean reversion’ into the future.
This directional dependency makes participants inherently cyclical and fragile.
The Commodity Trading Catastrophe (2010-2016)
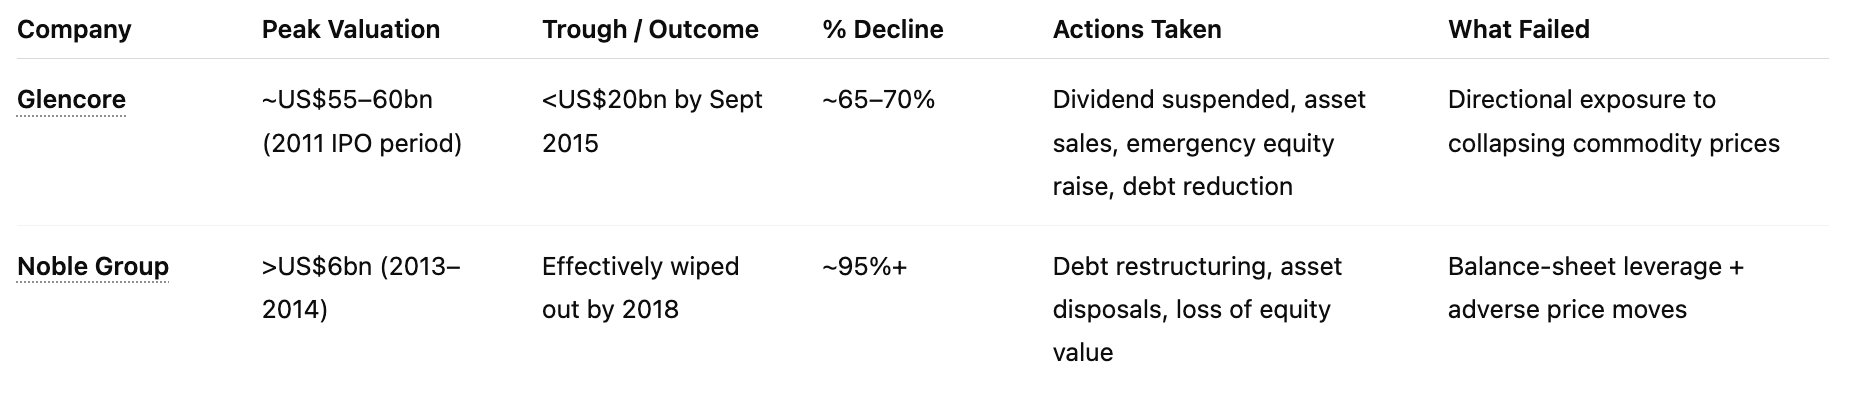
Consider the fate of commodity trading firms during the super-cycle collapse. Glencore, one of the world’s largest commodity traders, saw its market capitalization plummet from $60 billion in 2011 to under $20 billion by September 2015. A 65% decline as commodity prices collapsed.[^17] The company was forced to suspend its dividend, sell assets, and raise emergency capital to survive.
Noble Group, once Asia’s largest commodity trader with a market value exceeding $6 billion in 2014, essentially ceased to exist by 2018. Its shares fell 95% as commodity prices turned against its directional positions.[^18]
These were the biggest around. Their failure was structural: when oil fell from $115/barrel in June 2014 to $26/barrel by February 2016, and iron ore dropped from $135/ton to $40/ton over a similar period, no amount of operational excellence could overcome being on the wrong side of the market.[^19]
The Prodigal Active Manager
The asset management industry illustrates participant fragility from another angle. Active equity managers must not only generate positive returns but they must beat their benchmark consistently enough to justify their fees and retain assets under management. Those employing an active management strategy have had a torrid time over the last two decades due to the popularity of ‘ passive investing’ via ETFs.
From 2009 to 2019, 89% of large-cap U.S. equity fund managers underperformed the S&P 500 over a 10-year period.[^20] This isn’t an indictment of individual skill; it’s a mathematical consequence of being a participant in a positive-sum game with fee drag. When the market declines managers face redemptions. From 2000-2002, equity mutual funds experienced $200 billion in net outflows as investors fled falling markets.[^21]
The cyclicality is structural. In bull markets, assets under management grow, but so does competition. In bear markets, performance suffers and redemptions accelerate. The business model is effectively pro-cyclical.
Banking: Directional Risk in Disguise
Banks appear to operate infrastructure, but their profit model is predominantly directional. A bank lending $1 billion in commercial mortgages has made a directional bet on:
Real estate values (credit risk)
Interest rates (duration risk)
Economic growth (employment and income risk)
Monetary policy (refinancing risk)
The 2008 financial crisis demonstrated this fragility at scale. Lehman Brothers, Bear Stearns, Washington Mutual et al. failed because of their directional exposures primarily to residential mortgage-backed securities.[^22]
Even after the crisis, with enhanced capital requirements and stress testing, banks remain fundamentally directional. European banks, laden with sovereign debt exposures, saw their market capitalizations fall 50-80% during the 2011-2012 European debt crisis.[^23]
The Exchange Advantage: Volume-Driven, Direction Agnostic
Exchanges occupy a categorically different position. They do not normally participate in markets directly but rather they facilitate them. This distinction creates structural advantages:
Transaction Revenue, Not Directional Profit
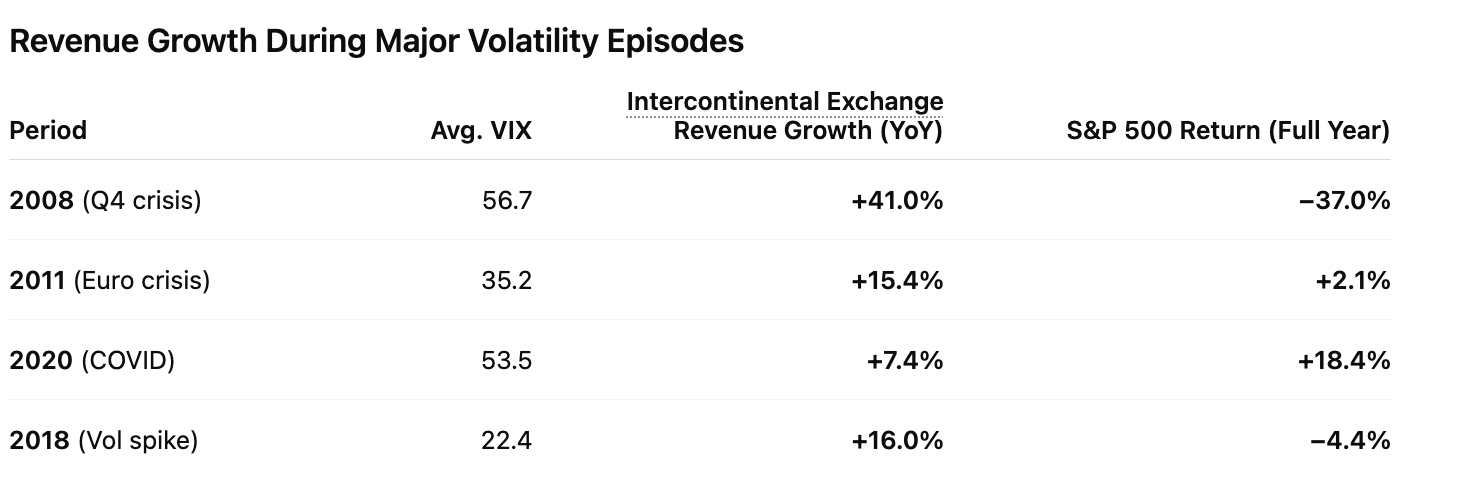
An exchange earns fees on each trade executed, regardless of whether the buyer or seller profits. When oil falls from $115 to $26/barrel, the CME Group which operates the NYMEX energy futures exchange doesn’t suffer the same fate as Glencore above.
During the 2014-2016 oil price collapse, while Glencore and Noble Group faced existential crises, CME Group’s energy trading volumes increased. In 2016, the CME’s average daily volume for crude oil futures reached 1.13 million contracts, up from 890,000 in 2013 - a 27% increase.[^24] Price volatility, which destroys directional participants, generates trading activity that enriches the exchange.
The mathematics are elegant: if a commodity trading firm loses $1 billion on a position, that loss came from trades where the exchange collected fees on both the opening and closing transactions. The exchange profited twice from the same market movement that may have bankrupted the participant.
Operating Leverage and Resilient Margins
Exchanges are characterized by extreme operating leverage: the marginal cost of processing an additional trade is effectively zero once the infrastructure is built. The low fixed costs structure allows a free call option to ‘right tail’ risk yet shields substantially from ‘left tail’ events.
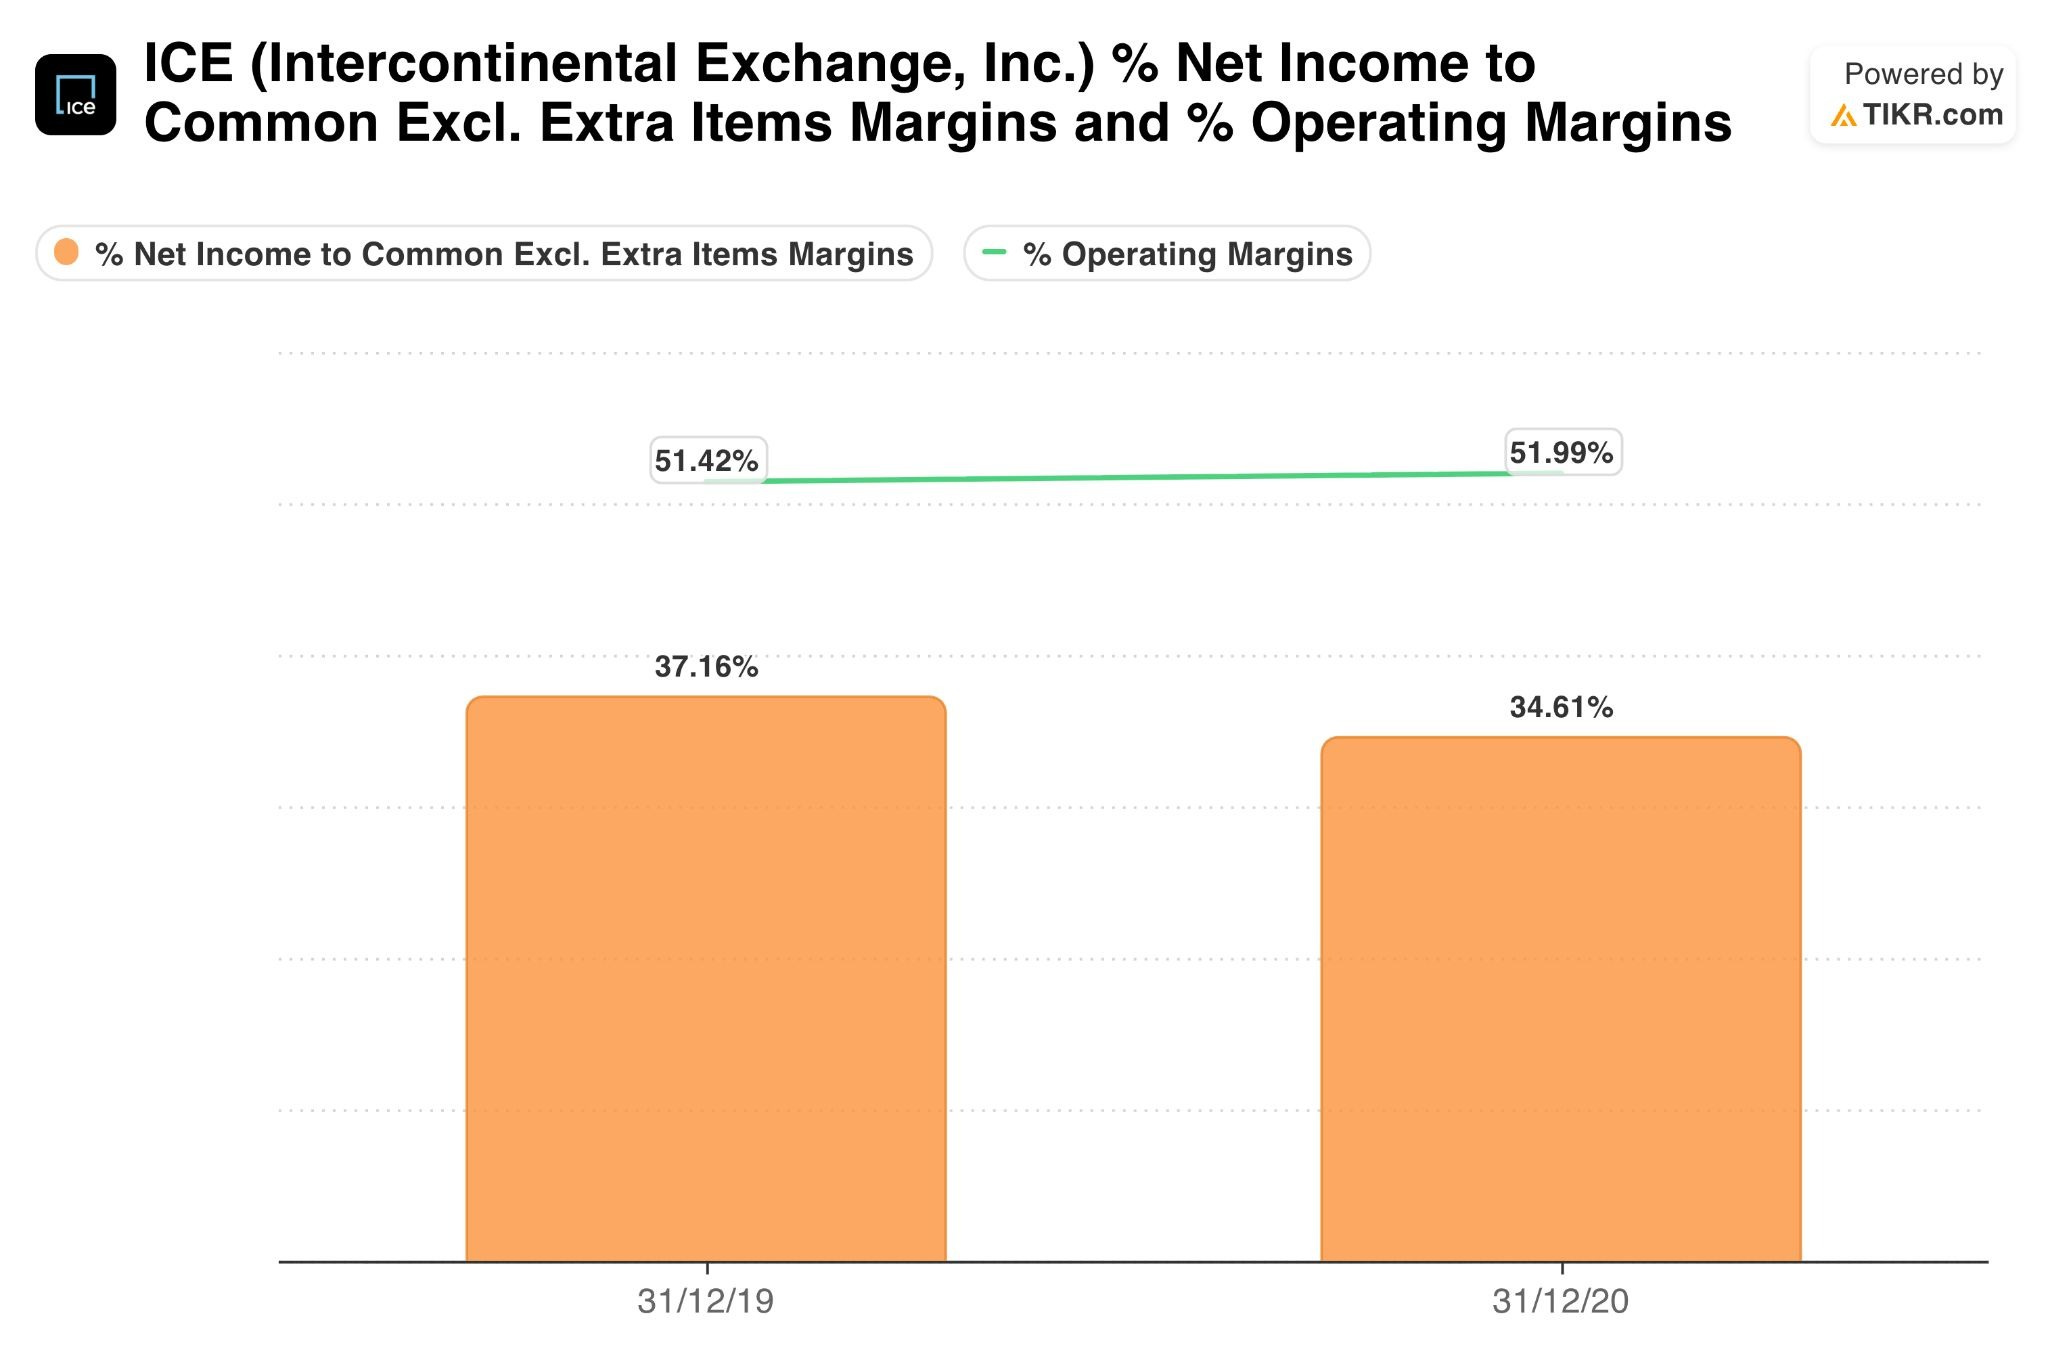
Consider the year 2020, disastrous for most publicly listed companies. Yet ICE, which owns the NYSE, reported operating and net income margins on par with the prior year as did its peers.
Furthermore, consider some examples of performance during market stress:
2008 Financial Crisis:
S&P 500: -37%
CME Group: -68% stock price. Revenue +45% YOY. Net Inc Margin +4% YOY [^27]
2020 COVID Crash (Q1):
S&P 500: -20% (peak to trough -34%)
Energy sector: -50%
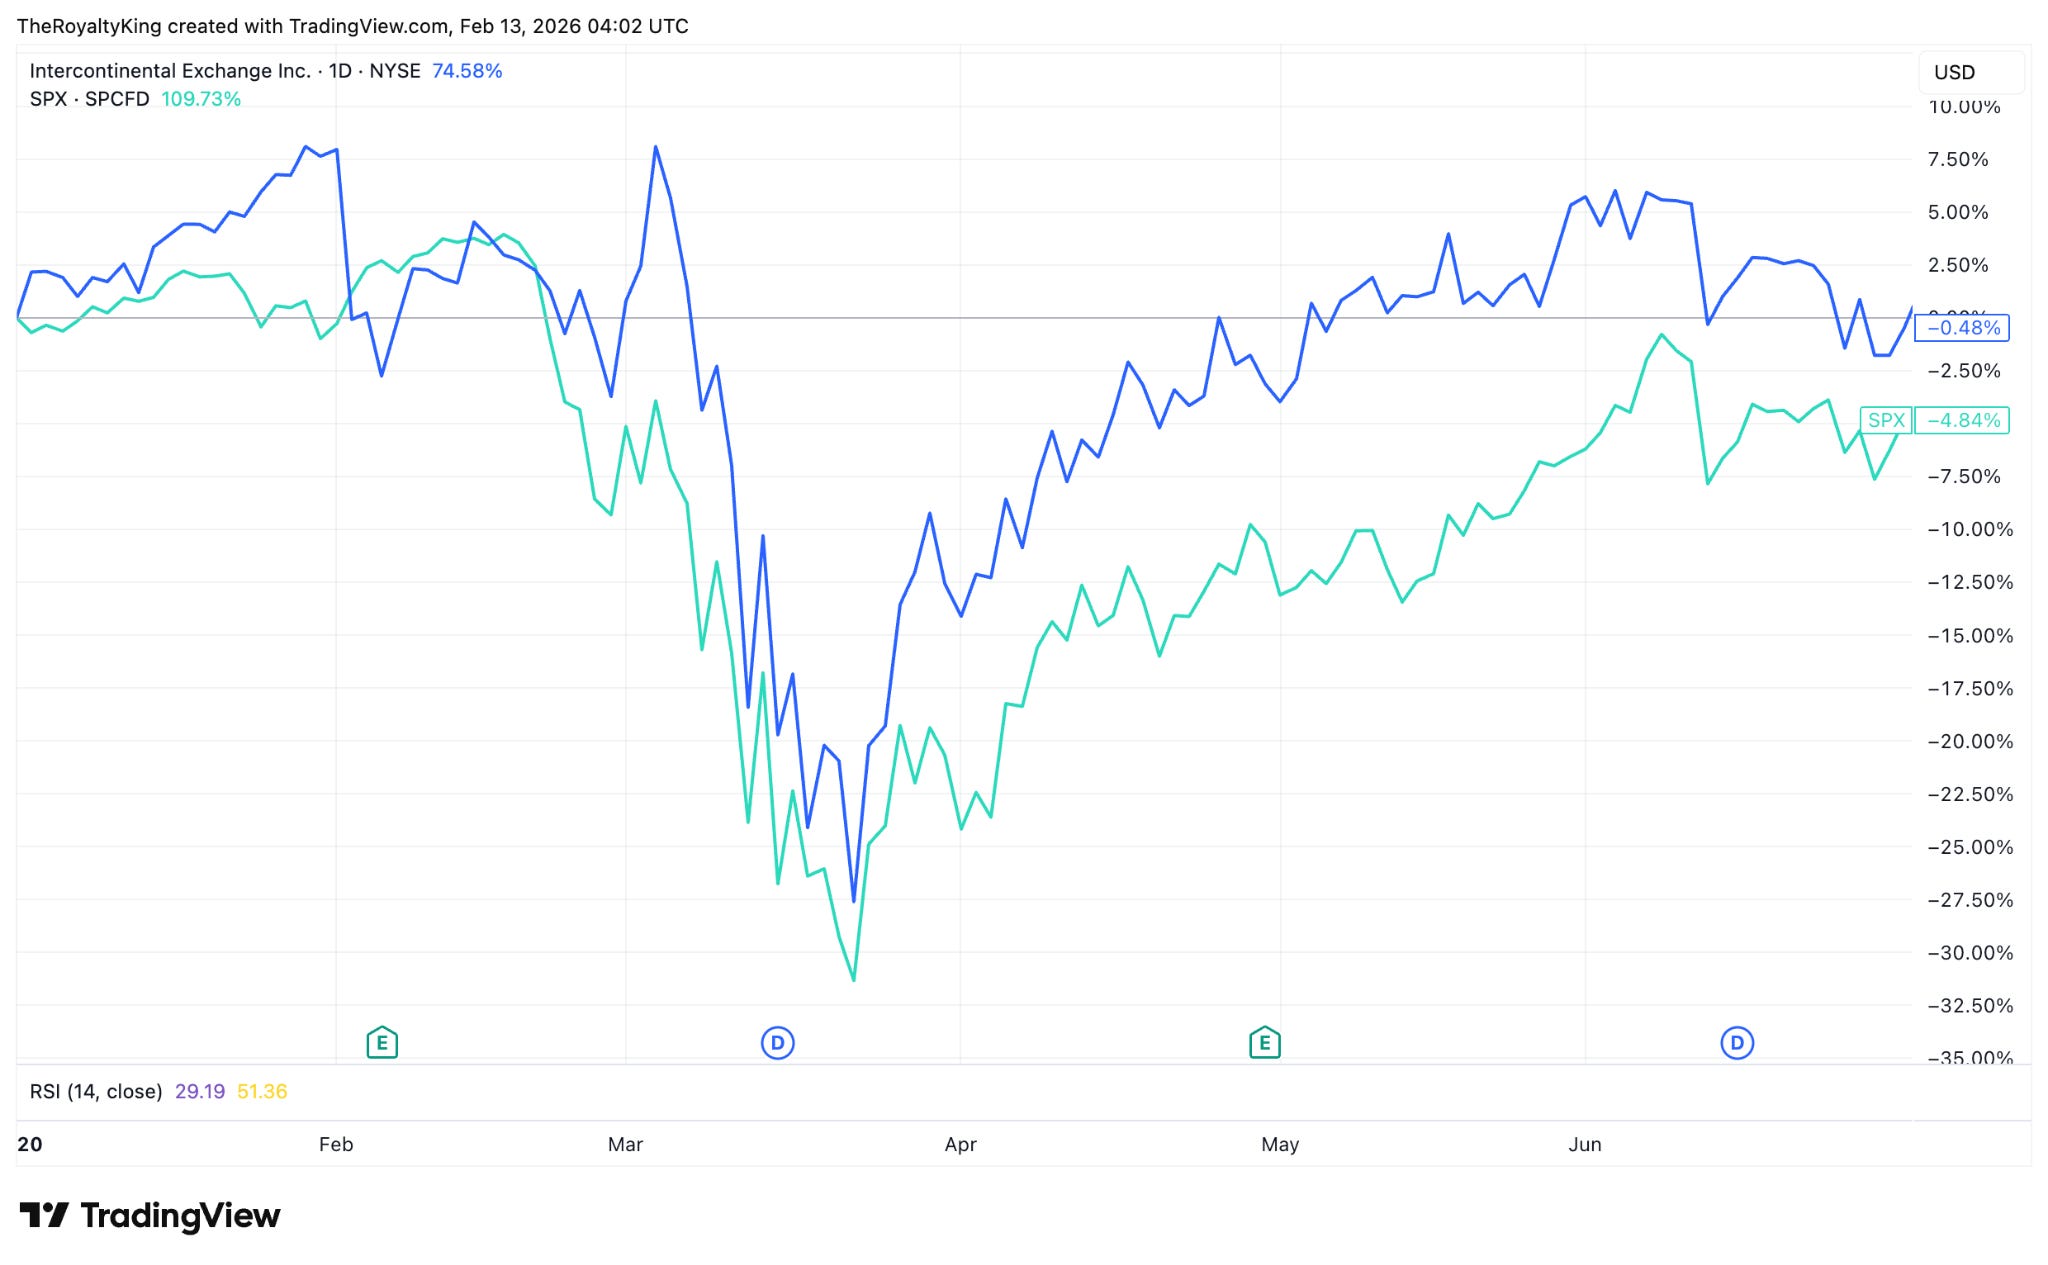
ICE: - 14%
The ICE dropped less during the Q1 crash and recovered faster.
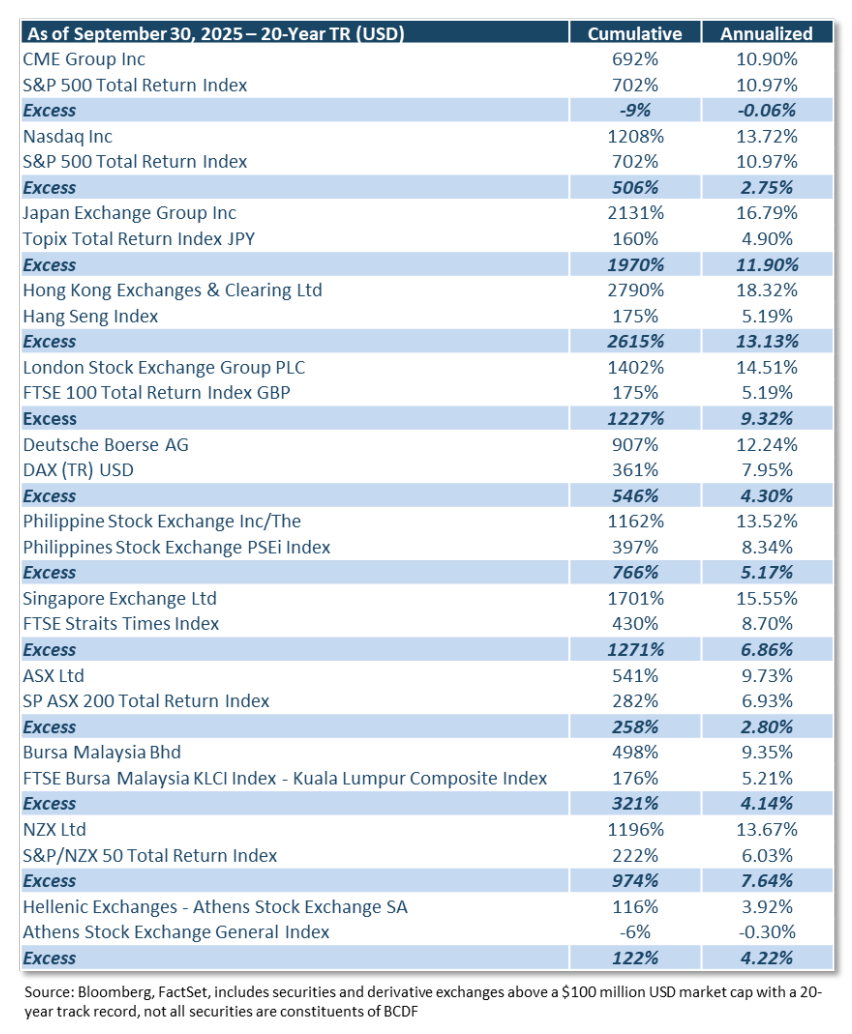
The Empirical Record: Exchanges Vs Indices
The performance difference between exchanges and active participants is empirically observable across decades and market cycles. But what of the passive investor’s battle cry:
“You can’t beat the index, so buy the index”?
Well, as a matter of fact, over long periods of time, exchanges themselves have generally outperformed the very indices they facilitate. Whilst perhaps counter-intuitive at first, examining the operations of the two investments in question makes it clearer.
When you invest in the S&P 500, you own a basket of 500 companies whose fortunes rise and fall with economic conditions. When you invest in the company that operates the exchange where those 500 companies trade, you own the toll booth through which all their activity must pass.
The difference between an index and an exchange may sound subtle but performance differential is anything but, as the reader is about to discover.
*From Horizon Kinetics Q3 Commentary Page 6.
The ETF Explosion:
The growth of passive investing and ETFs has inadvertently become one of the most powerful tailwinds for exchange revenues in modern financial history.
The Mechanics of ETF Trading.
When an investor buys shares of an S&P 500 ETF, three separate transactions occur:
The investor buys ETF shares on an exchange (exchange collects fees)
Periodically, the ETF provider may need to rebalance underlying holdings (exchange collects fees)
Authorized participants create/redeem ETF shares through underlying stock baskets (exchange collects fees)
The growth in ETF assets under management doesn’t just represent passive buy-and-hold behavior; it generates a massive increase in underlying trading activity, much of which is invisible to investors.
U.S. ETF Assets Under Management:5
2002: $102 billion
2012: $1.3 trillion
2022: $6.5 trillion
Growth: 6,270%
Average Daily ETF Trading Volume:6
2002: 35 million shares
2012: 950 million shares
2022: 4.2 billion shares
Growth: 11,900%
Note that trading volume grew nearly 2x faster than assets under management. This advantages the exchange as assets compound at market rates, but trading activity compounds faster due to rebalancing, arbitrage, and increasing portfolio turnover.
Index Rebalancing: The Hidden Revenue Stream
Major index rebalancing events generate extraordinary trading volumes. When a company enters or exits the S&P 500, every index fund and ETF tracking that index must execute the change. With over $15 trillion benchmarked to the S&P 500, even a 0.1% rebalancing represents $15 billion in forced trading activity.
Tesla S&P 500 Addition (December 2020):
Tesla market cap at inclusion: $658 billion8
Estimated index fund trading: $80-100 billion9
NYSE/NASDAQ volume on rebalancing day: 2.3x normal10
Exchange revenue impact: Undisclosed, but CME reported record options volume11
The companies being added or removed from indices experience significant volatility around rebalancing dates. The exchanges, by contrast, simply collect fees on the billions of dollars in forced trading activity.
Quarterly Rebalancing = Recurring Revenue.
Beyond headline additions and deletions, indices undergo quarterly rebalancing to maintain market-cap weights. As stock prices diverge, index funds must buy outperformers and sell underperformers to maintain target allocations.
Index funds can collectively trade ~$200 billion per quarter in rebalancing activity alone.12 At an average exchange fee of 0.0003% per transaction, or $2.4 million annually from a single index’s mechanical rebalancing.
Now multiply this across:
S&P 500, S&P 400, S&P 600
Russell 1000, 2000, 3000
MSCI indices (World, EAFE, Emerging Markets)
Dow Jones indices
NASDAQ indices
Sector and thematic indices
The recurring, non-discretionary nature of index rebalancing creates an annuity-like revenue stream for exchanges that happens like clockwork.
The Structural Moat: Why Don’t Exchanges Attract Competition?
The barriers are structural:
Network effects: Liquidity attracts liquidity. The most liquid venue captures the majority of trading, creating natural monopolies.
Regulatory franchise: Exchanges are granted regulatory authority as self-regulatory organizations, a privilege that cannot be replicated.
Switching costs: Market participants cannot easily migrate to new venues. Existing exchanges control access to established liquidity pools.
Technology moat: Decades of infrastructure investment and integration with clearing systems, data feeds, and participant systems create enormous switching costs.
A bank or broker cannot easily pivot to become an exchange. A failing hedge fund cannot transform into a marketplace operator. The business models are fundamentally distinct and the authors here argue that the exchange holds what we dub ‘structural alpha’ outperformance that derives not from superior insight or timing, but from occupying a structurally advantaged position in the financial ecosystem.
Exchanges vs Financial ‘Peers’
This advantage even extends against their closest industry peers, the banks, brokers, and asset managers that participate in the same markets.
Major banks underperformed exchanges by substantial margins, despite operating in the same financial ecosystem:
Bank Performance 2002-2026
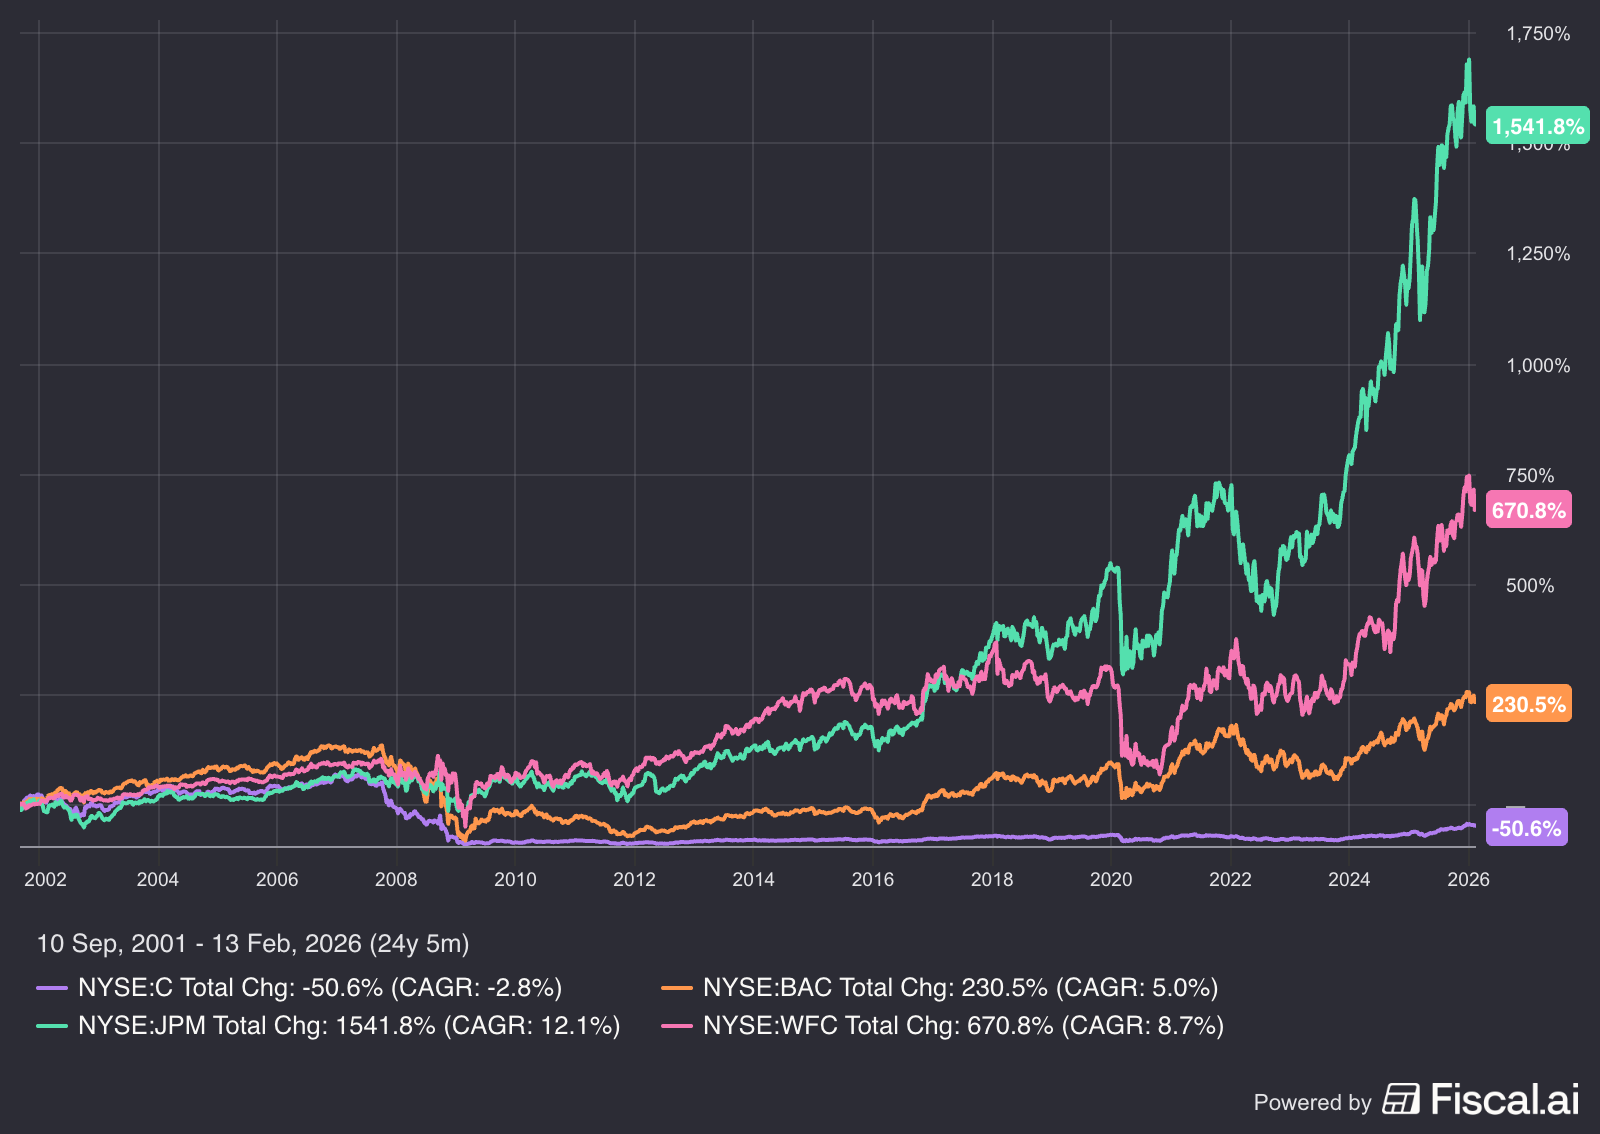
Average CAGR 5.75%
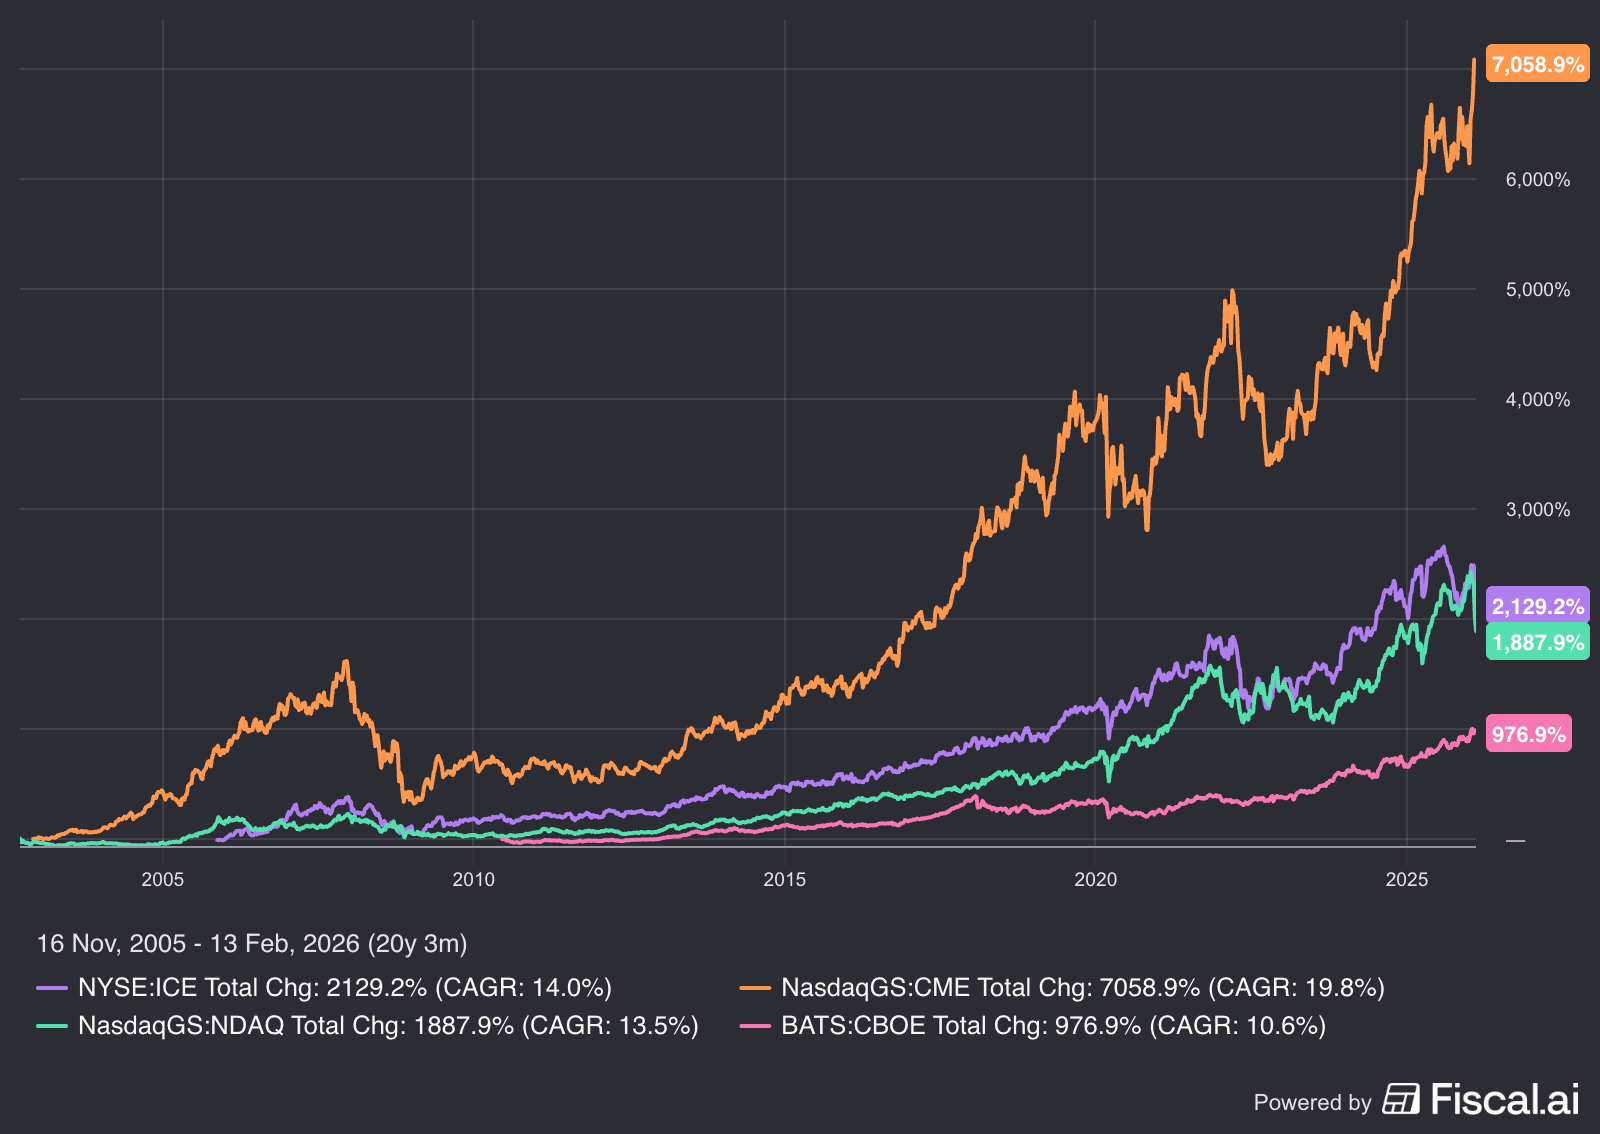
Ave CAGR 14.5%
The total market capitalisation of the above group of banks sits at $1.8 Trillion at the time of writing yet the largest 4 exchanges in the USA can be purchased collectively for $283 Billion.
Given various exchanges outperformed the average major bank by such a wide margin this author suggests the above market price discrepancy might represent one of the biggest mysteries in capital markets today.
Brokers: Disintermediated by Technology
The broker-dealer model faced potentially severe structural headwinds, as technological innovation and regulatory changes compressed commission revenues.
Broker-Dealer Performance
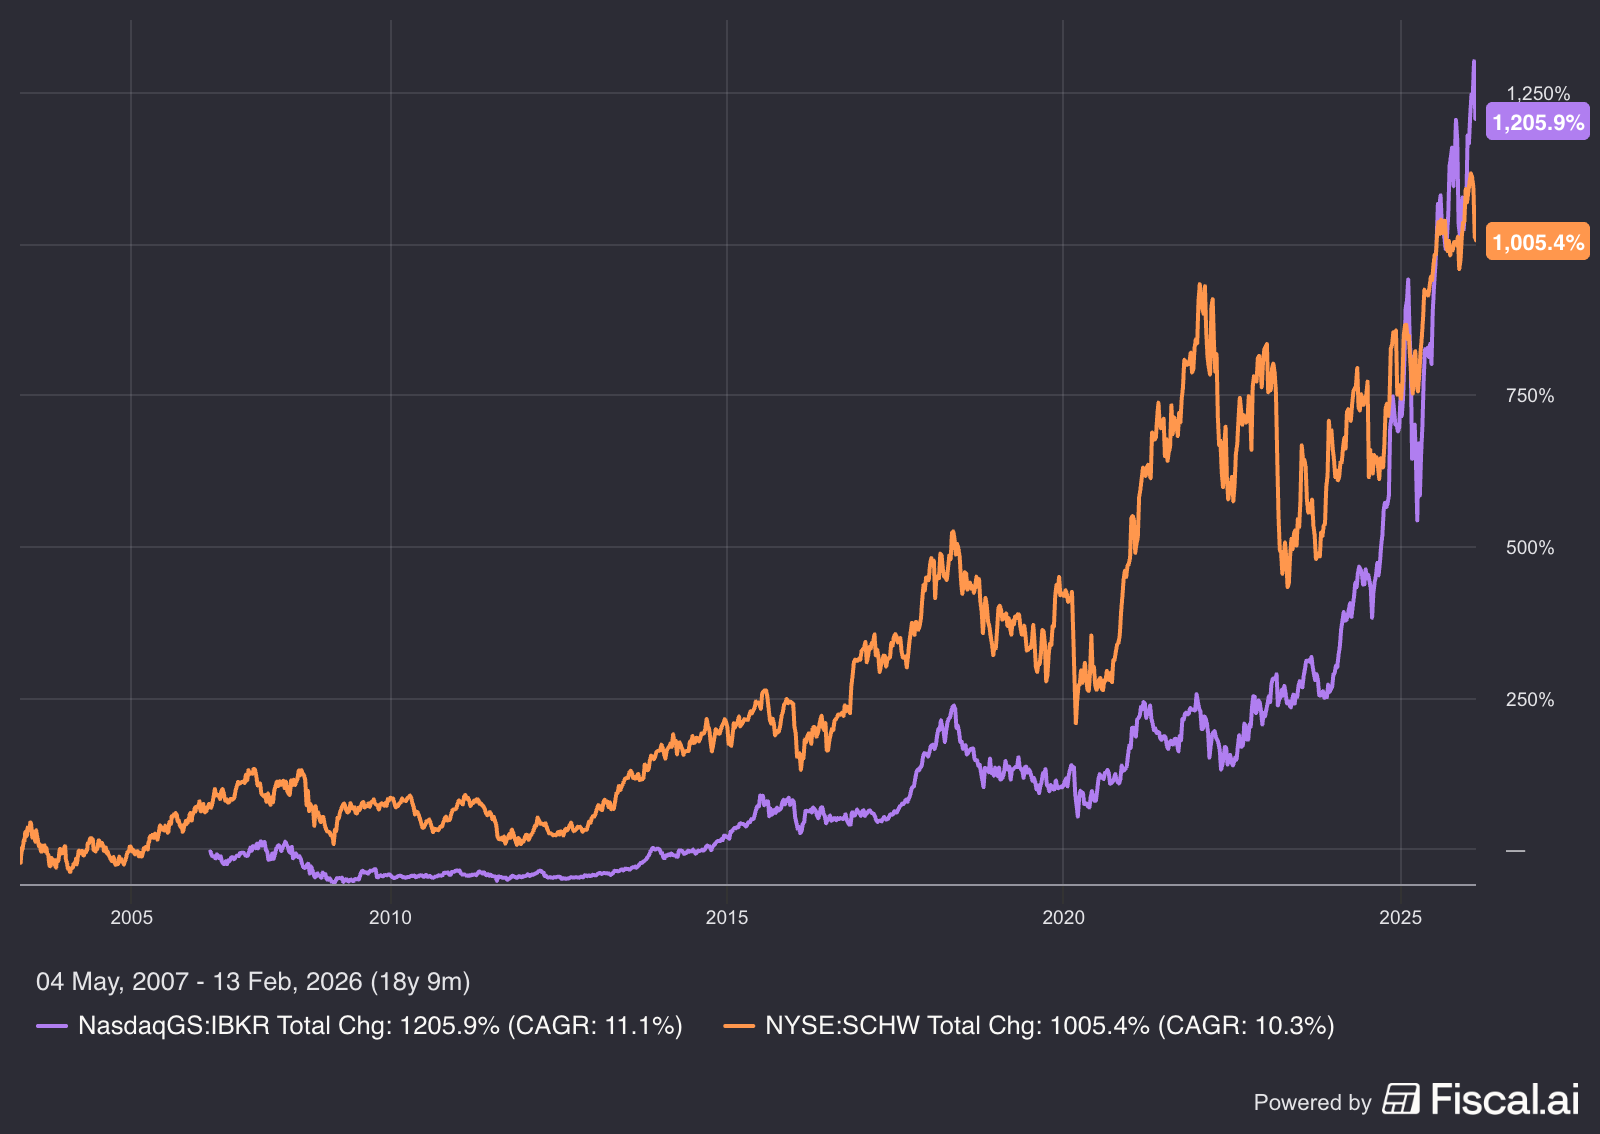
Whilst major brokerage platforms did well, they still lagged many exchanges and are often serial share diluters.
When Robinhood, the zero-commission pioneer went public in 2021, its largest expense line was payments to exchanges and market makers for order routing.[^55]
Performance During Volatility Spikes
An unusual characteristic of exchange operators is their positive relationship with market volatility which is precisely the opposite of most equity investments.
In the case of CME Group, periods of elevated volatility have historically coincided with materially stronger revenue growth, reflecting higher trading volumes and increased demand for risk transfer. When volatility rises sharply, activity accelerates; when markets are calm, growth moderates but remains positive.
The result is an equity business with an embedded hedge against market stress. Few operating companies benefit from disorder. Exchanges do. That asymmetry—earning more when volatility rises—has proven to be a rare and valuable attribute over full market cycles.
The negative correlation between exchange performance and broad market performance during stress periods creates natural portfolio diversification benefits. An allocation to exchanges reduces portfolio volatility.
Performance During Macro Transitions
Beyond crisis periods, exchanges have demonstrated adaptability during major macroeconomic regime changes—transitions that often disadvantage other sectors.
Rising Interest Rate Environment (2022-2023)
When the Federal Reserve engaged in its most aggressive tightening cycle in decades, growth stocks and long-duration assets sold off sharply as higher rates compressed valuations and raised discount rates. Technology-focused benchmarks such as the NASDAQ-100 fell significantly in 2022 before rebounding in 2023, while many unprofitable and high-duration tech stocks suffered deep drawdowns. By contrast, exchange operators weathered the tightening period with resilience: derivatives volumes and rate-hedging activity remained robust, supporting revenue growth even as broader markets fluctuated. CME Group’s stock, for example, declined in 2022 but recovered in 2023, while ICE continued to benefit from diversified trading and data-service revenue streams.
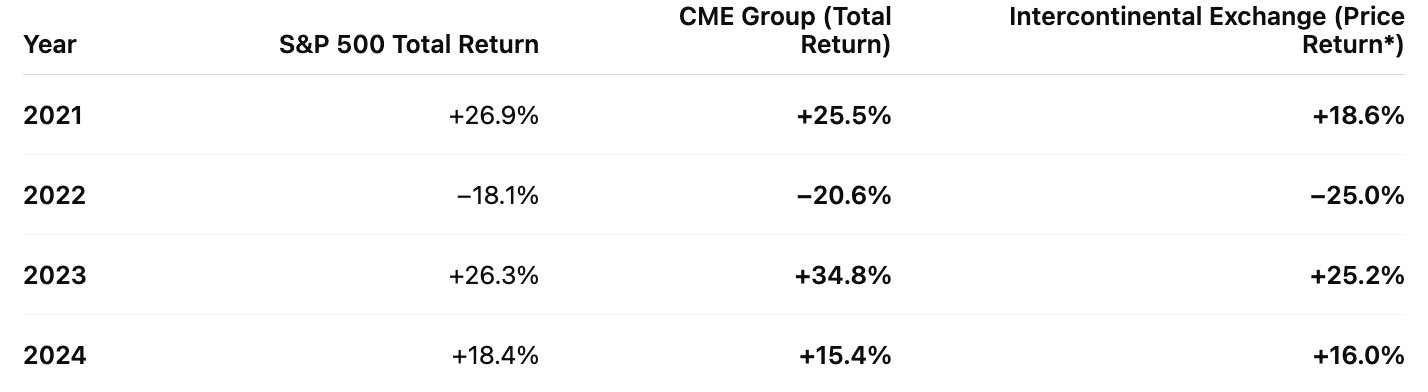
Inflationary Period (2021-2023)
Similarly, when inflation reached 40-year highs in 2022, exchanges benefited from increased hedging activity in commodity and currency markets.
CME’s commodities and energy trading volumes in 2022 increased 27% year-over-year, driven by inflation hedging demand.[^105] ICE’s energy futures volumes increased 18%.[^106] These are businesses that don’t just tolerate inflation—they monetize the uncertainty that inflation creates.
Zero Interest Rate Policy (2009-2021)
Conversely, during the extended period of near-zero interest rates and compressed volatility (2014-2019), exchanges faced an arguably less favourable revenue environment. Yet even during this challenging period—arguably the worst possible environment for a volatility-dependent business—exchanges remained consistently profitable and continued to grow.
Low-Vol Period (2014-2019)
Above: Even in their most challenging environment, exchanges outperformed the S&P 500’s return during the same period demonstrating that the floor on exchange performance remains high relative to alternatives.[^110]
Having examined the history and performance of exchanges to date, this paper now turns forward. The future is to be shaped by: stablecoins, tokenisation, and 24/7 global markets and thus demands a different lens: one fluent in both market structure and modern technology.
For that reason, I hand the pen to a younger, more neuroplastic brain whose brilliance is adept at examining operating models and what the future may bring. Hugo Navarro now takes the reader on a global tour of the model in practice, deep-diving into 29 publicly listed exchange operators aiming at ‘clipping the ticket’ on the panoply of newly tokenised products now trading 24/7, who sit at the intersection of capital markets and emerging infrastructure.
– Benjamin Demase
As my good friend Ben has explained, exchanges are one of the best business models: capital-light, high-margin, high-ROIC, and net beneficiaries of inflation and volatility, among other factors that are prominent in today’s markets and likely to persist.
In this second part of the article, we will go deeper into how these companies actually work. We will break down their revenue sources, discuss the catalysts and trends that can drive massive outperformance, and review a list of 29 publicly listed exchanges—essentially all the major exchange operators that are available in public markets.
Revenue Model Breakdown
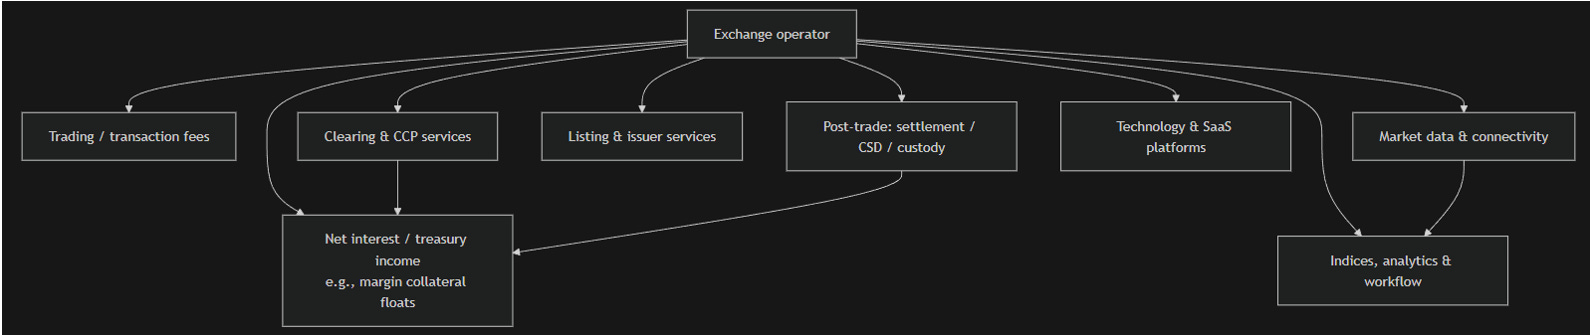
Exchanges today derive revenue from multiple business lines. They are not just fee collectors; they are also data and software providers, offering data and services that are extremely difficult to replicate.
The classic core of exchanges is transaction-based revenue – fees from trading, clearing and settlement – which still contributes roughly half (or more) of revenue for many operators. For example, at Deutsche Börse, ~35–40% of 2024 net revenue came from trading and clearing fees. Likewise, JPX (Japan Exchange Group) generated about 40% of its FY2024 revenue from trading services (exchange fees) and ~21% from clearing services . These fees rise with higher volumes and new product offerings, and they directly leverage market activity.
Another critical segment is listing and issuer services. Exchanges charge companies to list and to maintain listings (annual fees). This is a smaller but steady stream – often ~10–20% of revenue. For instance, listings made up ~20% of ASX FY2024 revenue (A$208M of A$1.03B) , ~14% of Euronext 2024 revenue (€231.9M of €1.627B) , and about 11% of JPX revenue . While listings are cyclical (dependent on IPO activity), they provide high-margin recurring fees from an installed base of listed companies.
Market data and indices have become the fastest-growing revenue source for many exchanges. Selling real-time data, historical data, and index licensing can generate 15–30% of revenues at larger groups. For LSEG, data & analytics (including Refinitiv terminals and FTSE Russell indexes) contributed roughly around half of total revenue in 2024 . Similarly, Nasdaq now gets almost half of its revenue from its Market Technology, analytics segment, and from data-driven “Investment Intelligence” and index businesses (grouped under its Capital Access Platforms) . Even more trading-focused groups have sizable data units – e.g., CME derives about 12% of revenue from market data. These information businesses are coveted for their high margins and subscription-like stability.
Exchanges also increasingly earn technology services and connectivity fees. This includes colocation (clients paying to place servers in exchange data centers), trading software, and platforms sold to other markets. Nasdaq and Deutsche Börse have been especially active here.
Finally, post-trade and ancillary services round out the revenue mix. Clearing houses and depositories (often owned by the exchange) collect clearing fees, custody fees, and sometimes earn net interest on collateral balances. For example, Clearstream (Deutsche Börse’s post-trade arm) and related banking services accounted for ~30% of Deutsche Börse’s 2024 revenues . Likewise, B3 (Brazil) and SGX (Singapore) derive significant revenue from their clearing, settlement, and depository services.
In sum, today’s exchanges are not only about fees. They are data providers with proprietary datasets, which give them a strong moat, and they are also service and software providers with high retention rates and meaningful pricing power.
In other words, you get the best of both worlds: a royalty on trading volumes and a growing stream of recurring data and software revenue. Contrary to popular belief, AI is unlikely to disrupt exchanges’ data and software services in a meaningful way because these businesses are built on proprietary datasets. You might be able to replicate the interface and even some functionality, but you would still need to buy the underlying data from the exchanges.
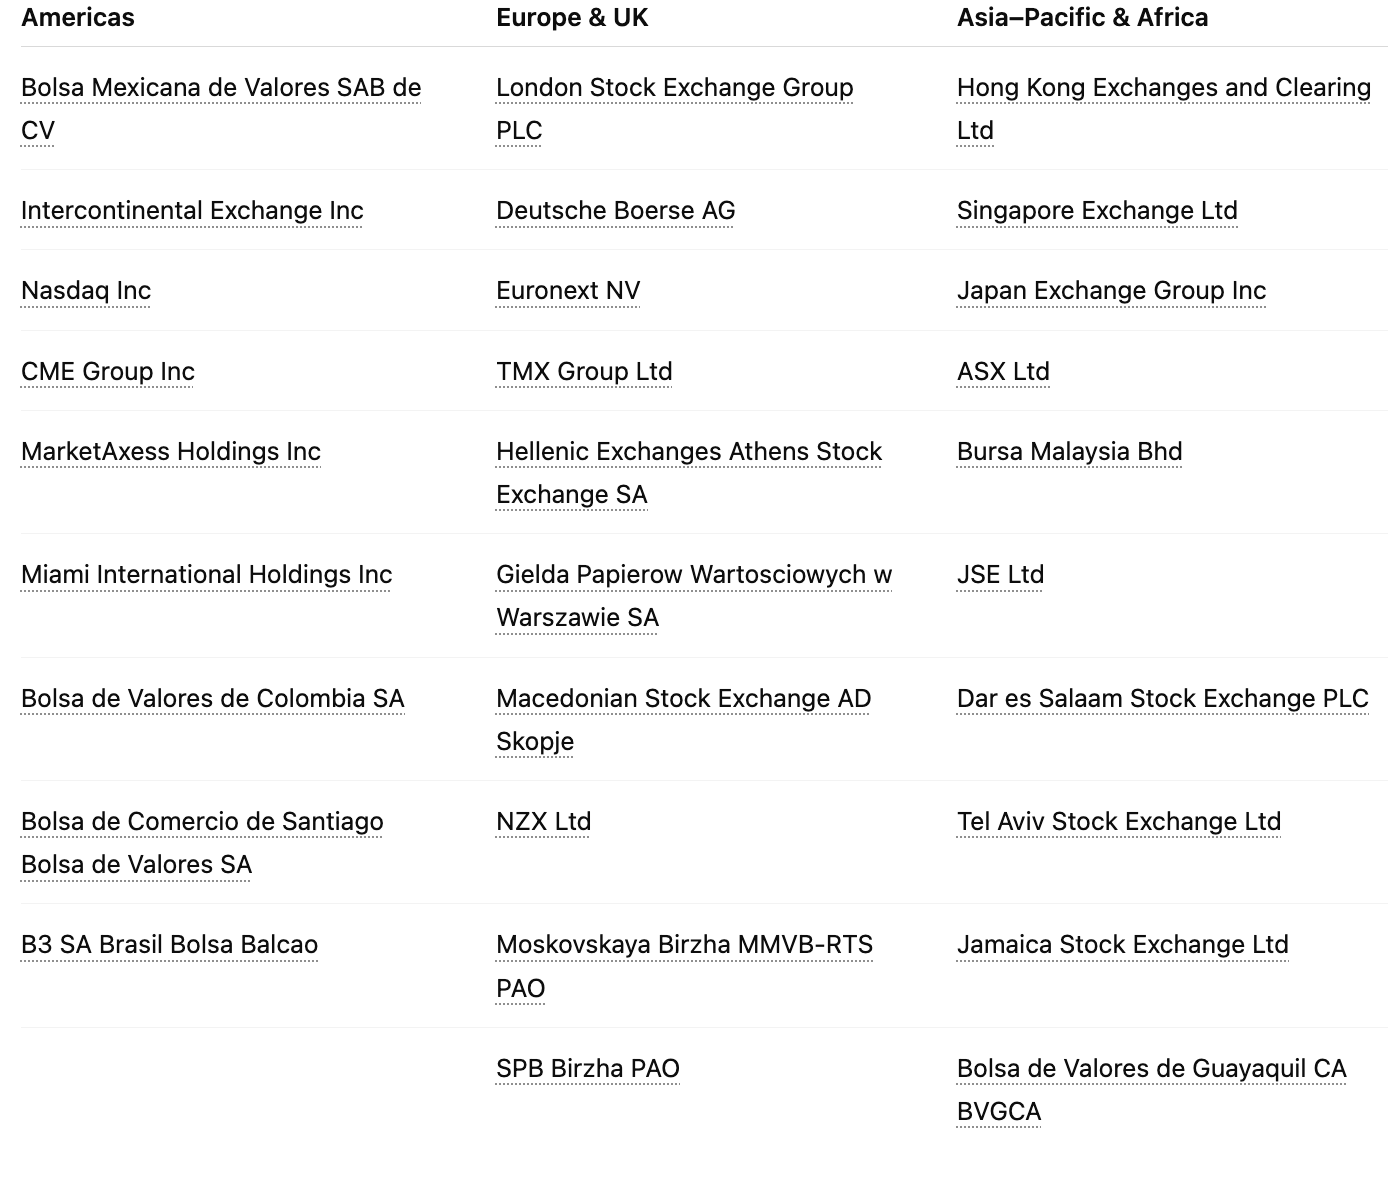
Analyzing at all of the exchanges:
The best way to find a great company is to look at all in its peer group. As the great Peter Lynch said, in investing the one who turns over more rocks wins. So we will look at all of the major publicly listed exchanges out there to understand this asset class better and maybe even find some favorites.
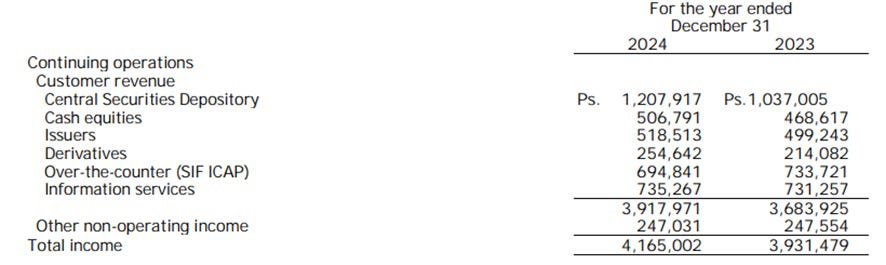
Bolsa Mexicana de Valores (BMV) (BOLSAA.MX)
Region exposure: Mexico (domestic equities), plus group exposure via Indeval (CSD), Asigna (CCP), SIF ICAP (OTC/brokered markets).
Market cap: $1.2b
Margins & Valuation: 54.6% EBITDA vs 59.1% (5Y avg); 6.75× EV/EBITDA; 7.00× forward EV/EBITDA .
Revenue / earnings split (FY2024): Revenue mix: CSD (Indeval) ~29%, Information services ~18%, OTC (SIF ICAP) ~17%, Issuers ~12%, Cash equities ~12%, Derivatives ~6%, Other ~5%.
Exchange description and valuation notes:
BMV trades at a single-digit multiple, which is incredibly cheap for an exchange. With a meaningful portion of revenue coming from data and information services, it has a solid mix that reduces its reliance on Mexican trading volumes alone.
The valuation is easily explained by the “EM discount,” but the business mix is closer to a market-infrastructure stack with meaningful recurring components than to an old-style, fee-only exchange.
Overall, the business quality is higher than you would typically expect from an emerging-market exchange. If interest in Latin America and Mexico increases, BMV has significant upside through both higher earnings and a potential multiple re-rating.
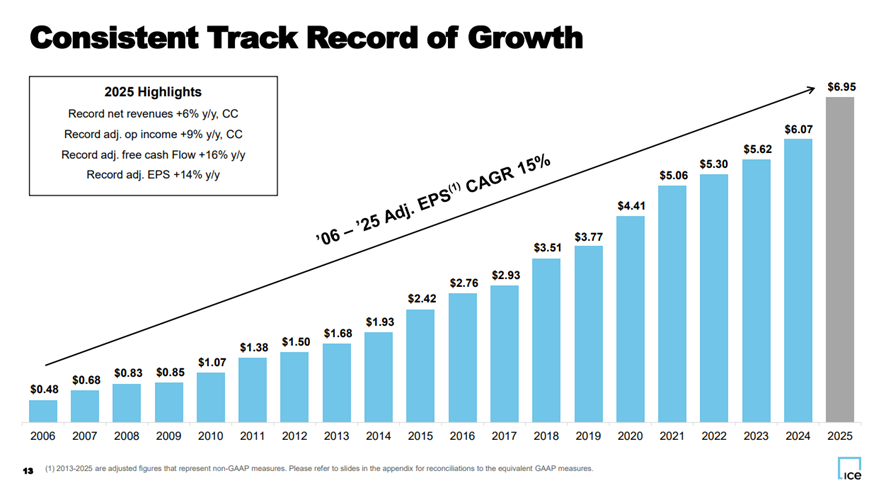
Intercontinental Exchange (NYSE: ICE)
Region exposure: US-centric earnings base with global scale (energy, rates, mortgages/data, clearing).
Market cap: $96.2b
Margins & Valuation: 66.1% EBITDA vs 50.2% (5Y avg); 17.54× EV/EBITDA; 16.17× forward EV/EBITDA.
Exchange description and valuation notes:
The valuation of ICE is on the high end for most exchanges, yet I don’t think it’s especially high given the quality and diversification of the business. Just look at the table below: they’ve compounded EPS at around 15% over the past 20 years. That’s not something you see often. They may be too large to fit the kind of hidden opportunities we typically look for, but ICE is still a prime example of how well the exchange model can work over the long term—especially as a case study in how accretive M&A can be in this sector.
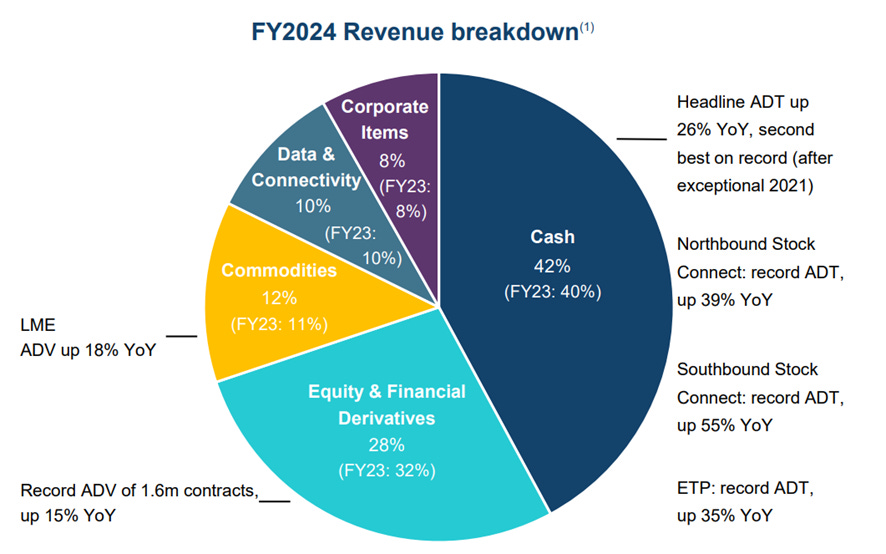
Hong Kong Exchanges and Clearing (HKEX: 0388)
Region exposure: Hong Kong / China access (Stock Connect, IPOs), plus global commodities via LME.
Market cap: $67.9b.
Margins & Valuation: 65.5% EBITDA vs 69.7% (5Y avg); 13.45× EV/EBITDA; 11.49× forward EV/EBITDA.
Revenue / earnings split (FY2024): Revenue mix stated broadly Cash market ~42%, Equity & financial derivatives ~20%, Clearing ~20%, Data/connectivity/other ~15–20% .
Exchange description and valuation notes:
HKEX is a “gatekeeper” asset: its valuation is anchored to China risk-premium, but its economics are driven by connect volumes + issuer cycle + derivatives + clearing, with a meaningful (and growing) data/connectivity component. It’s a great way to get exposure to the Chinese and Asia market, but it comes with the usual risks. The valuation is in the mid range for exchanges reflecting premium economics and large size but China’s risk premium.
London Stock Exchange Group (LSE: LSEG)
Region exposure: UK-listed, but economics are global via data/analytics, indices, FX, and post-trade.
Market cap: $51.8b.
Margins & Valuation: 53.1% EBITDA vs 47.4% (5Y avg); 10.81× EV/EBITDA; 10.55× forward EV/EBITDA .
Revenue / earnings split (FY2024): Mix stated as Data & Analytics + FTSE Russell = majority (~60%+ of income), with Post Trade and Capital Markets smaller but strategic.
Exchange description and valuation notes:
LSEG is the archetype of the “exchange → data platform” transition. The multiple has compressed mainly due to the UK “risk premium” and money flowing out from the UK, LSEG has been in place for centuries and its diversificated outside the UK despite having exposure to it. For those reasons the current multiple could represent an opportunity.
Competitive set is Bloomberg / S&P Global / CME / ICE / Nasdaq depending on segment; they have some higher competition in the data and analytics side, might deserve lower multiple from that angle
Nasdaq (Nasdaq: NDAQ)
Region exposure: US-led with meaningful Europe footprint and global market-technology clients.
Market cap: $49.3b.
Margins & Valuation: 37.7% EBITDA vs 33.0% (5Y avg); 18.81× EV/EBITDA; 17.09× forward EV/EBITDA.
Revenue / earnings split (FY2024): Mix stated as Market Services ~51%; remainder from market technology + anti-financial-crime + analytics/workflow.
Exchange description and valuation notes:
Nasdaq is another of the biggest exchanges out there, its valuation reflects a premium as its related to US tech stocks, that’s also the reason why it has been selling off aggressively over the past weeks with the meltdown in SaaS.
Core competition is NYSE/ICE in listings and LSEG/ICE in data.
Deutsche Börse (Xetra: DB1)
Region exposure: Europe/Germany with global scale in derivatives, clearing, and post-trade.
Market cap: $47.1b
Margins & Valuation: 48.1% EBITDA vs 46.9% (5Y avg); 13.75× EV/EBITDA; 13.50× forward EV/EBITDA.
Revenue / earnings split (FY2024): Mix described as broadly split across Trading & Clearing (~40%), Post-trade/settlement and data/analytics make the rest
Exchange description and valuation notes:
I see Deutsche Börse as being valued similarly to Hong Kong Exchanges: strong economics and good diversification, but with exposure to a less attractive region like Europe. That’s why its valuation tends to sit in the mid range for exchanges.
Cboe Global Markets (BATS: CBOE)
Region exposure: US-heavy, with Europe equities and global derivatives expansion.
Market cap: $29.4b.
Margins & Valuation: ~30% EBITDA vs 29.6% (5Y avg); 17.39× EV/EBITDA; 16.27× forward EV/EBITDA .
Revenue / earnings split (FY2024): Mix stated as Options ~50%, with remainder across equities, futures, FX, and data.
Exchange description and valuation notes:
Cboe is essentially an options pure play with embedded growth call options (0DTE, rising retail engagement, and global derivatives expansion). It’s one of the cleaner ways to express a “volatility bull case” over the coming years, as options and other new products see broader adoption among retail investors and as 24/7 trading becomes more widespread.
Singapore Exchange (SGX: S68)
Region exposure: Singapore-based gateway to Asia; strong international derivatives franchise.
Market cap: $15.3b.
Margins & Valuation: 63.8% EBITDA vs 58.2% (5Y avg); 20.76× EV/EBITDA; 20.47× forward EV/EBITDA.
Growth: they target 6-8% organic revenue growth over the medium term in their multi asset strategy.
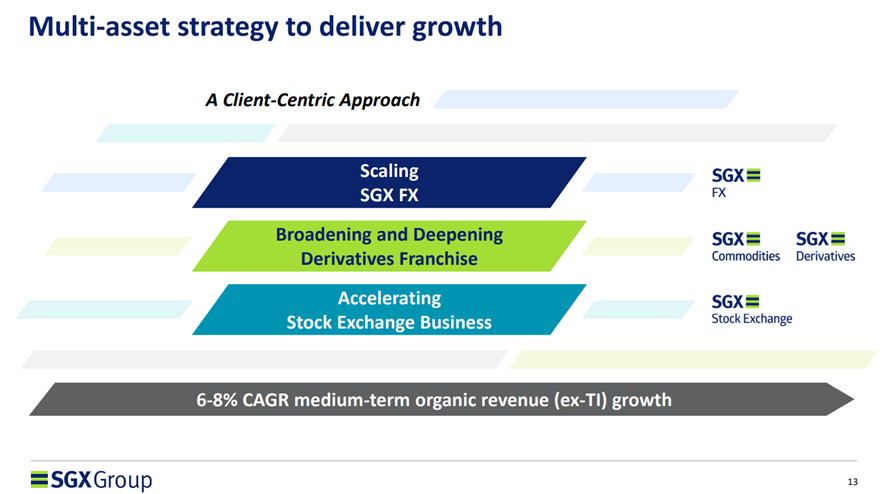
Revenue / earnings split (FY2024): Mix stated as roughly Equities ~27%, Equity derivatives ~27%, FICC/commodities and data/other remainder.
Exchange description and valuation notes:
SGX often trades “expensive” compared to other exchanges, it is not a pure equities venue: it monetizes Asia hedging demand (FX/commodities/rates) with durable clearing economics and a strong dividend profile, while offering sustainable and diversified growth. The key sensitivity is whether international derivatives remain structurally sticky versus competing offshore contracts. Competitors include HKEX, CME, ICE (contract competition).
Euronext (ENX Paris: ENX)
Region exposure: Pan-European (multi-country cash equities + derivatives + post-trade).
Market cap: $14.8b.
Margins & Valuation: 62.0% EBITDA vs 60.3% (5Y avg); 12.76× EV/EBITDA; 13.12× forward EV/EBITDA.
Revenue / earnings split (FY2024): Mix stated as Trading ~34%, with meaningful post-trade + data/tech contributions.
Exchange description and valuation notes:
Euronext is the consolidator play: the equity is effectively an investment on M&A + synergy extraction in European market infrastructure. The multiple is cheap as the European market is less attractive than the US one, which gets us to a valuation in line with other peers in the same situation, great economics but unattractive underlying markets.
TMX Group (TSX: X)
Region exposure: Canada core, with global data/analytics and energy/OTC adjacency.
Market cap: $9.6b.
Margins & Valuation: 33.4% EBITDA vs 38.2% (5Y avg); 15.05× EV/EBITDA; 14.56× forward EV/EBITDA.
Revenue / earnings split (FY2024): Mix stated as GSIA (data/analytics/Trayport) ~45%, with remainder across capital formation, trading, clearing, trust.
Exchange description and valuation notes:
TMX Group is another example of strong economics and a meaningful share of recurring, data-related revenues. However, its valuation still reflects its relatively pure exposure to Canada—more attractive than much of Europe, but less than the U.S.—which tends to place it in the middle of the range. Competition is mainly from offshore substitution for listings and trading.
*A comment from Benjamin: There does exist a lesser known Canadian exchange: the Canadian Securities Exchange (CSE/CNSX) tailored toward junior companies. The shares are not publicly available (yet) however investors can gain exposure on a look-through basis via investing in Urbana corp.
Moscow Exchange (MOEX) and SPB Exchange (Russia)
Both Russian exchanges are currently not available for many investors to trade. This is a clear example of the black swan risks that can arise when an exchange is heavily dependent on a single geography, which can expose it to war-related events. This is also one of the reasons emerging-market exchanges tend to trade at lower valuations than developed-market peers.
Trading halts are a particularly important risk for exchanges. They don’t just prevent you from exiting a position; they can also materially reduce the underlying business’s revenues while the market is closed.
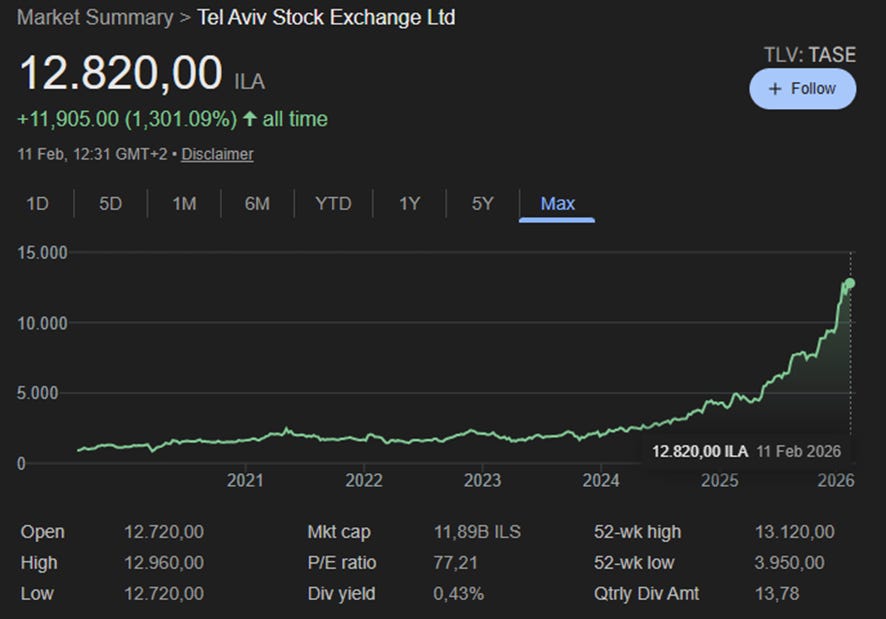
Tel Aviv Stock Exchange (TASE)
Region exposure: Israel domestic equities and bonds; strategic push to deepen markets.
Market cap: $3.7b.
Margins & Valuation: 42.0% EBITDA vs 37.2% (5Y avg); 44.57× EV/EBITDA
Revenue / earnings split (FY2024): Mix stated as Trading & clearing ~38% vs other services (incl. data/connectivity/index/other) making up for the rest.
Exchange description and valuation notes:
The multiple looks “expensive” because the market is underwriting a mix shift away from pure transaction fees. The TASE bull case is simple: a small exchange can grow earnings quickly if it (i) expands data and connectivity monetization, (ii) strengthens the listing pipeline, and (iii) captures a larger share of local savings flows into market products. Competition is mainly offshore dual listings—Nasdaq and NYSE siphoning liquidity—rather than another Israeli venue.
Bursa Malaysia (RIC: BMYS.KL)
Region exposure: Malaysia (cash equities, derivatives, data).
Market cap: $1.9b.
Margins & Valuation: 53.4% EBITDA vs 58.3% (5Y avg); 12.80× EV/EBITDA; 11.75× forward EV/EBITDA.
Revenue / earnings split (FY2024): Exact % mix not provided here
Exchange description and valuation notes:
Bursa is a classic high-margin local monopoly with a strong dividend posture. The valuation is typically capped by modest domestic market growth, but upside phases occur when Malaysia gets (i) higher retail participation, (ii) stronger IPO pipeline, or (iii) better data/product monetization.
Hellenic Exchanges (FRA: HEE)
Region exposure: Greece (cash equities).
Market cap: $417.9m.
Revenue / earnings split:
Margins & Valuation: 45.5% EBITDA vs 39.3% (5Y avg); 6.29× EV/EBITDA; 7.56× forward EV/EBITDA.
Exchange description and valuation notes:
It looks cheap due to the “Greek discount,” and it has performed well recently as the country has started to post stronger growth. Liquidity is still thin and investor interest remains limited, but does it really deserve to trade at a lower valuation than Mexico? There is room to expand data services and other non-trading revenue streams.
NZX (RIC: NZX.NZ)
Region exposure: New Zealand (cash equities), plus funds/wealth tech and niche derivatives adjacencies.
Market cap: $279.4m.
Margins & Valuation: 40.2% EBITDA vs 39.7% (5Y avg); 10.46× EV/EBITDA; 10.77× forward EV/EBITDA.
Revenue / earnings split (FY2024): Mix stated as Markets ~52%, Funds (“Smart”) ~36%, Wealth tech ~8%, Regulation ~3% (earnings split not provided).
Exchange description and valuation notes:
NZX is small but interesting because it’s not just an exchange. If the platform monetizes funds and wealth-management rails effectively, it can look less like a micro exchange and more like a market-services compounder. Competition is mainly offshore listing substitution for larger issuers.
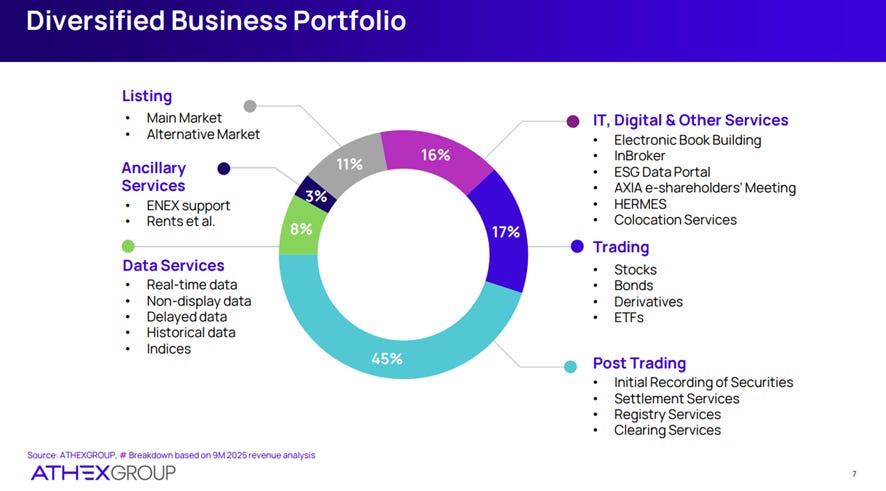
B3 (Brasil Bolsa Balcão) (RIC: B3SA3.SA)
Region exposure: Brazil (dominant domestic venue; multi-asset)
Market cap: $18.4b (from Excel).
Margins & Valuation: 70.0% EBITDA vs 73.8% (5Y avg); 13.97× EV/EBITDA; 14.00× forward EV/EBITDA.
Revenue / earnings split (FY2024): 69% markets, 6% capital markets solutions, 10% data and analytics, 16% technology and platforms.
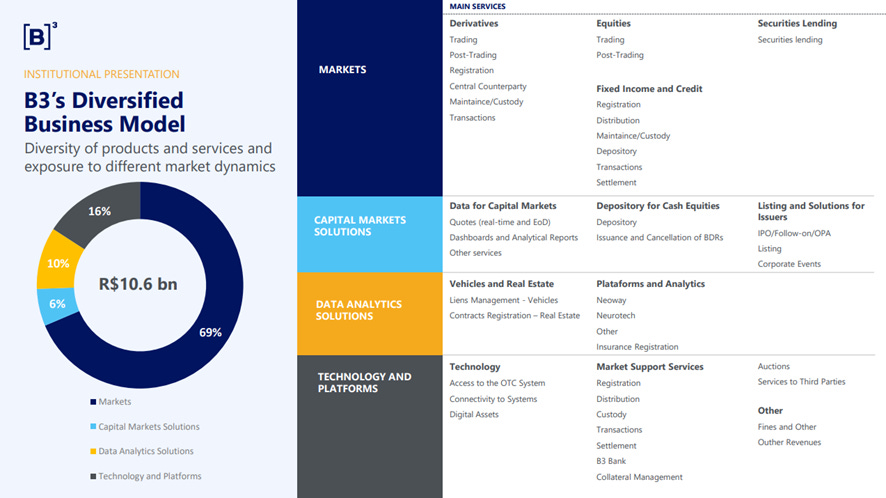
Exchange description and valuation notes: B3 has a very complete offering, with multiple products across most key segments of Brazil’s financial markets. As a result, its valuation depends primarily on Brazil’s macro environment and regulatory backdrop. Overall, it’s a relatively safe, capital-light way to gain exposure to Brazilian markets.
CME Group (Nasdaq: CME) (Derivatives play)
Region exposure: US-based, global derivatives benchmark venue
Market cap: $110.8b (from Excel).
Margins & Valuation: 84.0% EBITDA vs 75.7% (5Y avg); 22× EV/EBITDA; 22.34× forward EV/EBITDA
Revenue Mix: Predominantly derivatives trading and clearing fees (~81% of 2024 revenue) – spanning futures and options on interest rates, equity indexes, energy, metals, FX, etc. CME’s franchise includes the Fed Funds and SOFR futures, WTI crude, corn, the S&P 500 E-mini, and many benchmark contracts. Market data is ~12% of revenue.
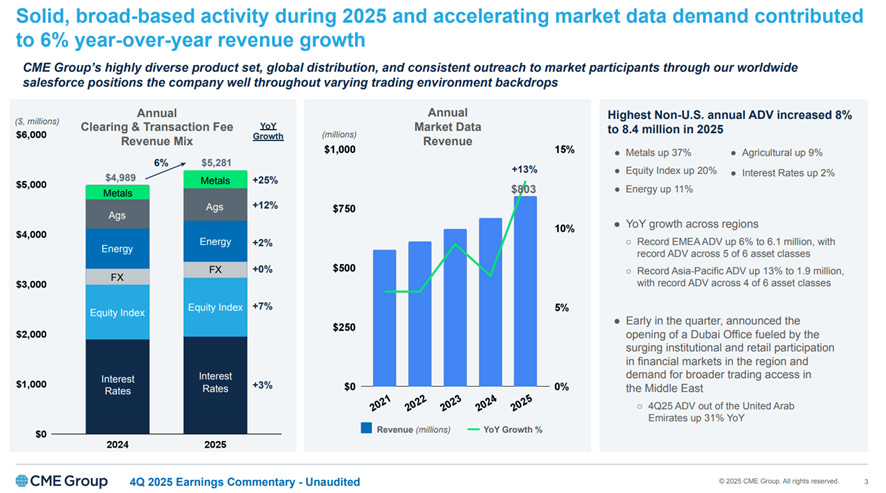
Exchange description and valuation notes:
CME is the purest listed play on derivatives and a clear beneficiary of uncertainty, hedging demand, and speculation. Its premium valuation reflects both its premium margins and its pure exposure to the derivatives model.
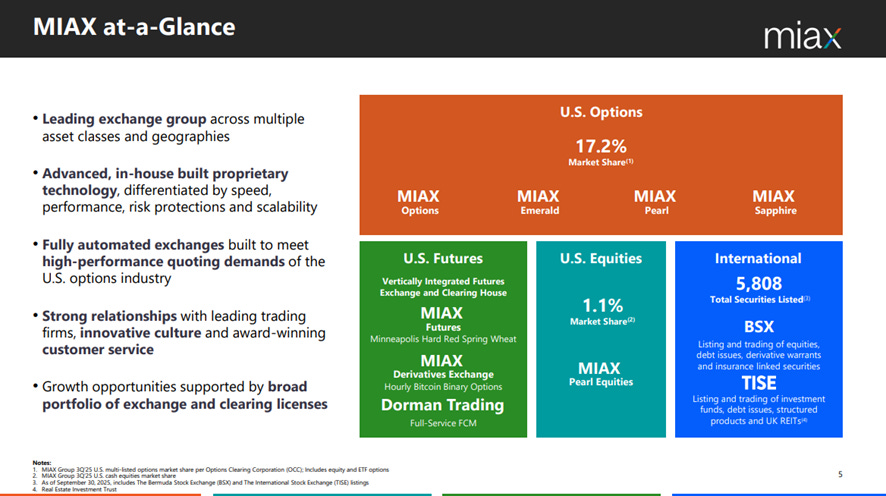
MIAX / Miami International Holdings (NYSE: MIAX)
Region exposure: US options (multiple options exchanges) + equities venue (Pearl), expanding via acquisition/roll-up.
Market cap: $3.5b.
Margins & Valuation: 9.5% EBITDA vs 2.8% (5Y avg); 36.00× EV/EBITDA; 16.67× forward EV/EBITDA.
Revenue / earnings split:
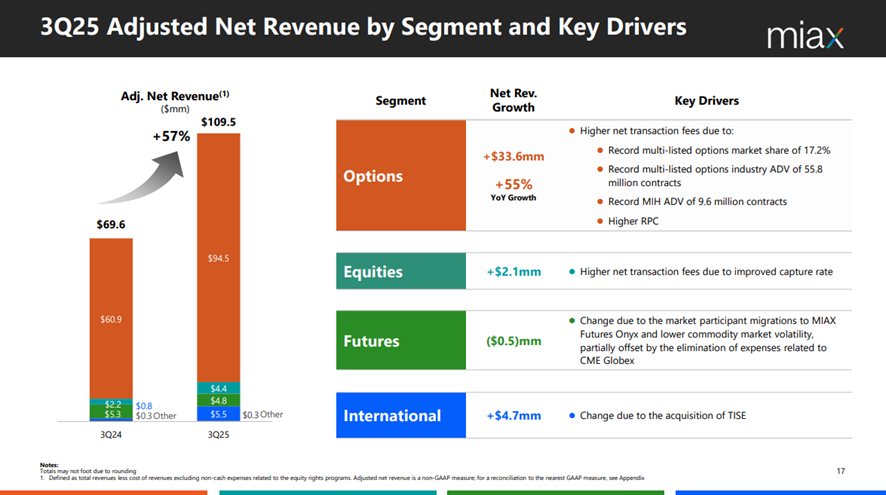
Exchange description and valuation notes:
MIAX is best framed as an options platform: scale matters because the economics improve with market share and technology leverage. The elevated EV/EBITDA likely reflects one-off costs from the recent IPO and profitability that is not yet fully annualized; once you adjust for one-offs and annualize recent growth, the multiple should sit closer to 18x.
MIAX is not a long-established operator. It’s a clear example that, with sufficient capital and time, you can carve out a competitive position in this industry. With close to a fifth of the U.S. options market, it is probably the fastest-growing exchange operator out there and looks highly promising.
ASX Ltd (Australia) (RIC: ASX.AX)
Region exposure: Australia.
Market cap: $7.8b.
Margins & Valuation: 62.7% EBITDA vs 67.9% (5Y avg); 12× EV/EBITDA
Revenue / earnings split:
Exchange description and valuation notes:
ASX is a classic defensive monopoly with regulated-like characteristics. The valuation screens cheap given the strong growth and momentum in its key revenue-generating segments. It is also valued broadly in line with European peers, while offering better underlying market exposure—Australia provides meaningful commodity-linked exposure, which can be a structural tailwind.
Japan Exchange Group (JPX)
Region exposure: Japan (cash equities + derivatives + clearing).
Market cap: $12.0b.
Margins & Valuation: 65.4% EBITDA vs 65.8% (5Y avg); 13.57× EV/EBITDA; 14.67× forward EV/EBITDA.
Revenue / earnings split (FY2024): Mix stated as Trading services ~40% and Clearing ~21%, plus listing/info/other.
Exchange description and valuation notes:
JPX is “high-quality but slower”: strong moat, high margins, but growth is structurally moderated by Japan’s market dynamics. Competition is limited domestically; catalyst sensitivity is primarily Japan equity cycle + reforms,
Warsaw Stock Exchange (GPW) (RIC: GPW.WA)
Region exposure: Poland / CEE hub.
Market cap: $860.9m (from Excel).
Margins & Valuation: 35.5% EBITDA (FY0) vs 43.3% (5Y avg); 15.00× EV/EBITDA; 12.37× forward EV/EBITDA (from Excel).
Revenue / earnings split:
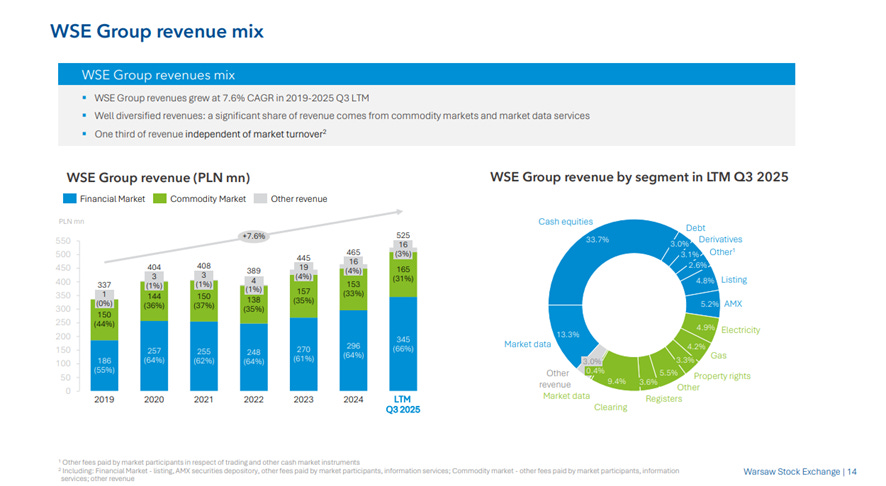
Exchange description and valuation notes: GPW’s valuation looks cheap, reflecting its exposure to Central and Eastern Europe. However, the exchange is seeing stronger growth driven by higher market participation and strong index performance in Poland. In addition, with a relatively small share of data- or service-based revenues today, GPW has a significant opportunity to evolve into a more modern exchange and diversify away from pure transaction fees. This is the kind of setup that helped drive “10-bagger” returns for the Tel Aviv Stock Exchange.
Short notes on smaller / frontier listed exchanges
Dar es Salaam Stock Exchange (DSE.TZ, Tanzania) — A small, domestically focused venue that lists and trades shares, bonds, and REITs, and plays an explicit “capital markets development” role in Tanzania. It began operating in the late 1990s and remains a relatively low-liquidity market where incremental participation (new listings, pensions/retail flows) can move volumes disproportionately.
Jamaica Stock Exchange (JSE.JS, Jamaica) — A frontier exchange with an unusually important Junior Market alongside the Main Market, designed to broaden SME access to equity funding (including policy/tax-support features).
Bolsa de Valores de Guayaquil (BVG.GQ, Ecuador) — A very small Ecuadorian listed exchange operator whose core purpose is enabling local securities trading and disseminating real-time market information. Like many micro-cap exchanges, the investment case is less about “taking share” and more about whether the domestic market deepens (issuer engagement, product adoption, local savings participation).
Macedonian Stock Exchange (MB.MKE, North Macedonia) — The country’s principal exchange, established in 1995 with first trading in 1996. Its flagship benchmark is the MBI10 blue-chip index; the market is structurally thin, so price discovery and liquidity are the binding constraints—but reforms and foreign access vehicles (where available) can matter a lot at the margin.
Bolsa de Comercio de Santiago (BOLSASTGO.SN, Chile) — Chile’s historic primary exchange (founded 1893) with trading across equities and fixed income, and relevance for broader regional integration initiatives. A key domestic competitive reference point is the Bolsa Electrónica de Chile, which operates as a second major Chilean trading venue.
Bolsas y Mercados Argentinos (BYMA, Argentina) — Argentina’s main exchange operator, structurally tied to domestic capital market functioning and—crucially—ownership of most of Caja de Valores (custody/registry infrastructure). In practice, the equity behaves like a high-beta expression of Argentina’s macro regime (FX/inflation stabilization vs relapse), where “market normalization” can rapidly lift activity, but policy risk dominates.
Bolsa de Valores de Colombia (BVC.CN, Colombia) — Colombia’s listed exchange group with meaningful “market infrastructure” character (not just trading), and a strategic orientation toward building scale and regional relevance through integration initiatives (nuam). The investment reality is that liquidity constraints and domestic market depth matter as much as competitive dynamics.
JSE Ltd (JSEJ.J, South Africa) — Africa’s largest exchange by market capitalisation and a diversified, multi-asset market-infrastructure operator.
Current Valuations
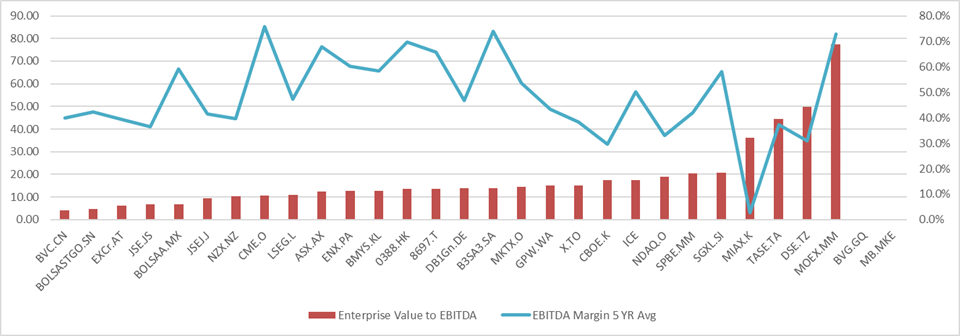
After looking at all the listed exchanges, a clear pattern emerges: the larger the exchange and the more attractive the underlying market, the higher the valuation. We see single-digit valuations for many emerging-market exchanges, low-teens for Europe and parts of Asia, and high-teens to twenties for U.S. exchanges. There are also exceptions: higher-growth exchanges can trade at elevated current valuations, effectively pricing in future growth.
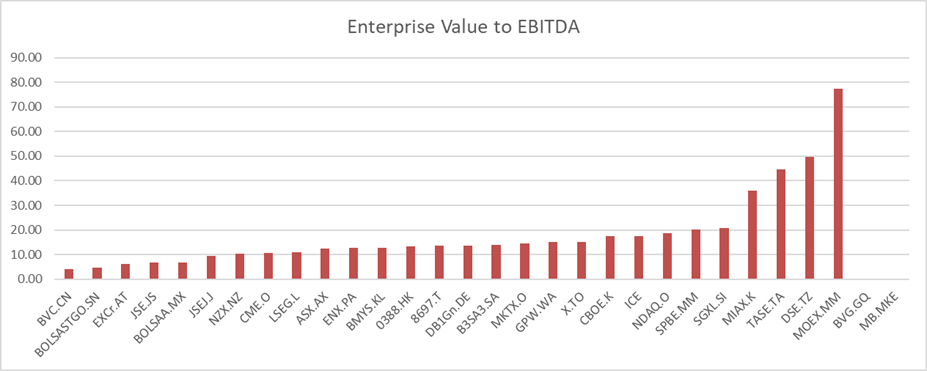
Margins are high across the sector, ranging from the low 30s for the least profitable operators to the mid-70s for the strongest and most profitable ones.
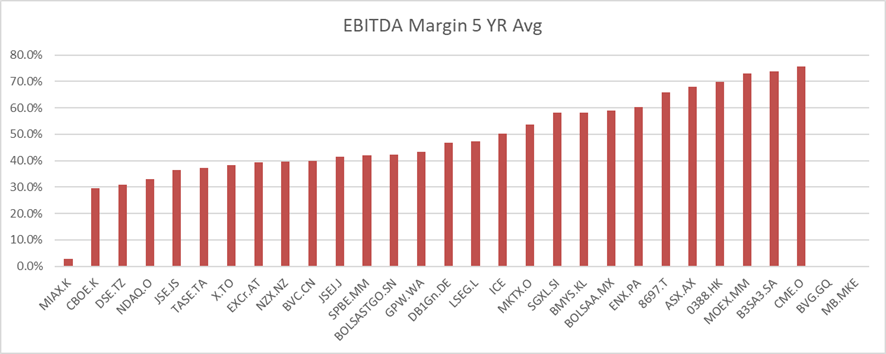
There is some correlation between valuations and margins, but valuation correlates more strongly with growth, market quality, and scale than with margins alone.
Future Catalysts
My colleague Benjamin has already explained how exchanges behave during different economic and macro regimes, so here I will add two additional catalysts that can drive periods of massive outperformance.
First, the shift from fee-based revenue to service/data-based revenue. A clear example is the Tel Aviv Stock Exchange, which delivered a 10-bagger return. When exchanges move from a transaction-fee model toward data and services, growth can accelerate and multiples can re-rate, because the business becomes more diversified and resilient. For more mature exchanges, new product lines can also be a major driver. New futures contracts or other products are costly to build and may take time to become profitable because they need volume to scale. But once they achieve product-market fit, they can scale dramatically with minimal incremental costs. If a mature exchange launches products that the market adopts, it can reaccelerate growth.
Second, M&A. Acquisitions are a real opportunity for exchanges because significant synergies can be extracted from these operations. However, they are difficult to execute: regulation is tight and antitrust hurdles are meaningful. When these transactions do get done, they often create substantial shareholder value.
Therefore, when evaluating any specific exchange, beyond the market backdrop and macro positioning, you should look for company-specific catalysts that could reignite growth. If both the macro setup and company execution are in your favor, you may be looking at a massive winner.
The Investment Case For Exchanges - Hugo’s Take
You will probably invest in an exchange if you believe the underlying market will rise, or if you expect higher trading volumes, more listings, or greater demand for data. That’s what I like about exchanges: at the macro level, if you like a region and see it as an attractive investment opportunity, exchanges can be one of the best securities to express that view. They don’t just benefit from higher asset prices — they also benefit from increased attention and activity. They win in multiple ways, whereas buying individual securities in a country typically makes you money in only one way.
For bottom-up investors, exchanges can also offer opportunities for large returns that are not purely driven by the macro backdrop or by what the underlying market is doing. If you invest in a consolidator that executes strong M&A, or if you identify an exchange ahead of substantial and successful product launches, you can generate outstanding returns.
Personally, I see exchanges as one of the best ways to gain exposure to regions like Asia or Latin America. If my thesis is correct, the exchange doesn’t just earn more because asset prices rise and demand for data increases — it can also see a multiple re-rating. Most importantly, I avoid exposure to single-company dynamics and long-tail risks, which can be unpredictable in emerging markets. In many cases, you also benefit from low probabilities of direct competition and from business models that are difficult to disrupt.
From a risk perspective, what matters is that the valuation you pay is reasonable relative to peers. For example, if you buy B3 at the same valuation as Nasdaq, you are unlikely to make as much money. Also, beware of competition and consolidation. Local exchanges may be quasi-monopolies domestically, but if local companies prefer to list abroad to access deeper capital markets, you won’t capture that value — so watch for that risk.
– Hugo Navarro
If you enjoyed this research report please like, subscribe and re-stack to spread the word.
References
Full source list and citations are available here:
royaltyking.notion.site/Exchange-Whitepaper-References
Disclaimer: This publication is intended solely for documenting my personal journey with trading and investments for income and travel purposes. I am not a certified financial advisor nor am I a financial professional and none of the content provided should be construed as investment advice. It is essential to conduct your own thorough research and consult a registered financial service provider for appropriate guidance. I cannot guarantee the accuracy or completeness of the information presented. Any actions taken based on the information shared in any of my work are done at your own risk and discretion.
 | A guest post by
|
Athex hellenic stock exchange is bought in 2025 by euronext and its majority of shares are now in possesion of euronext and delisting of athex on athens stock exchange is very probable.