
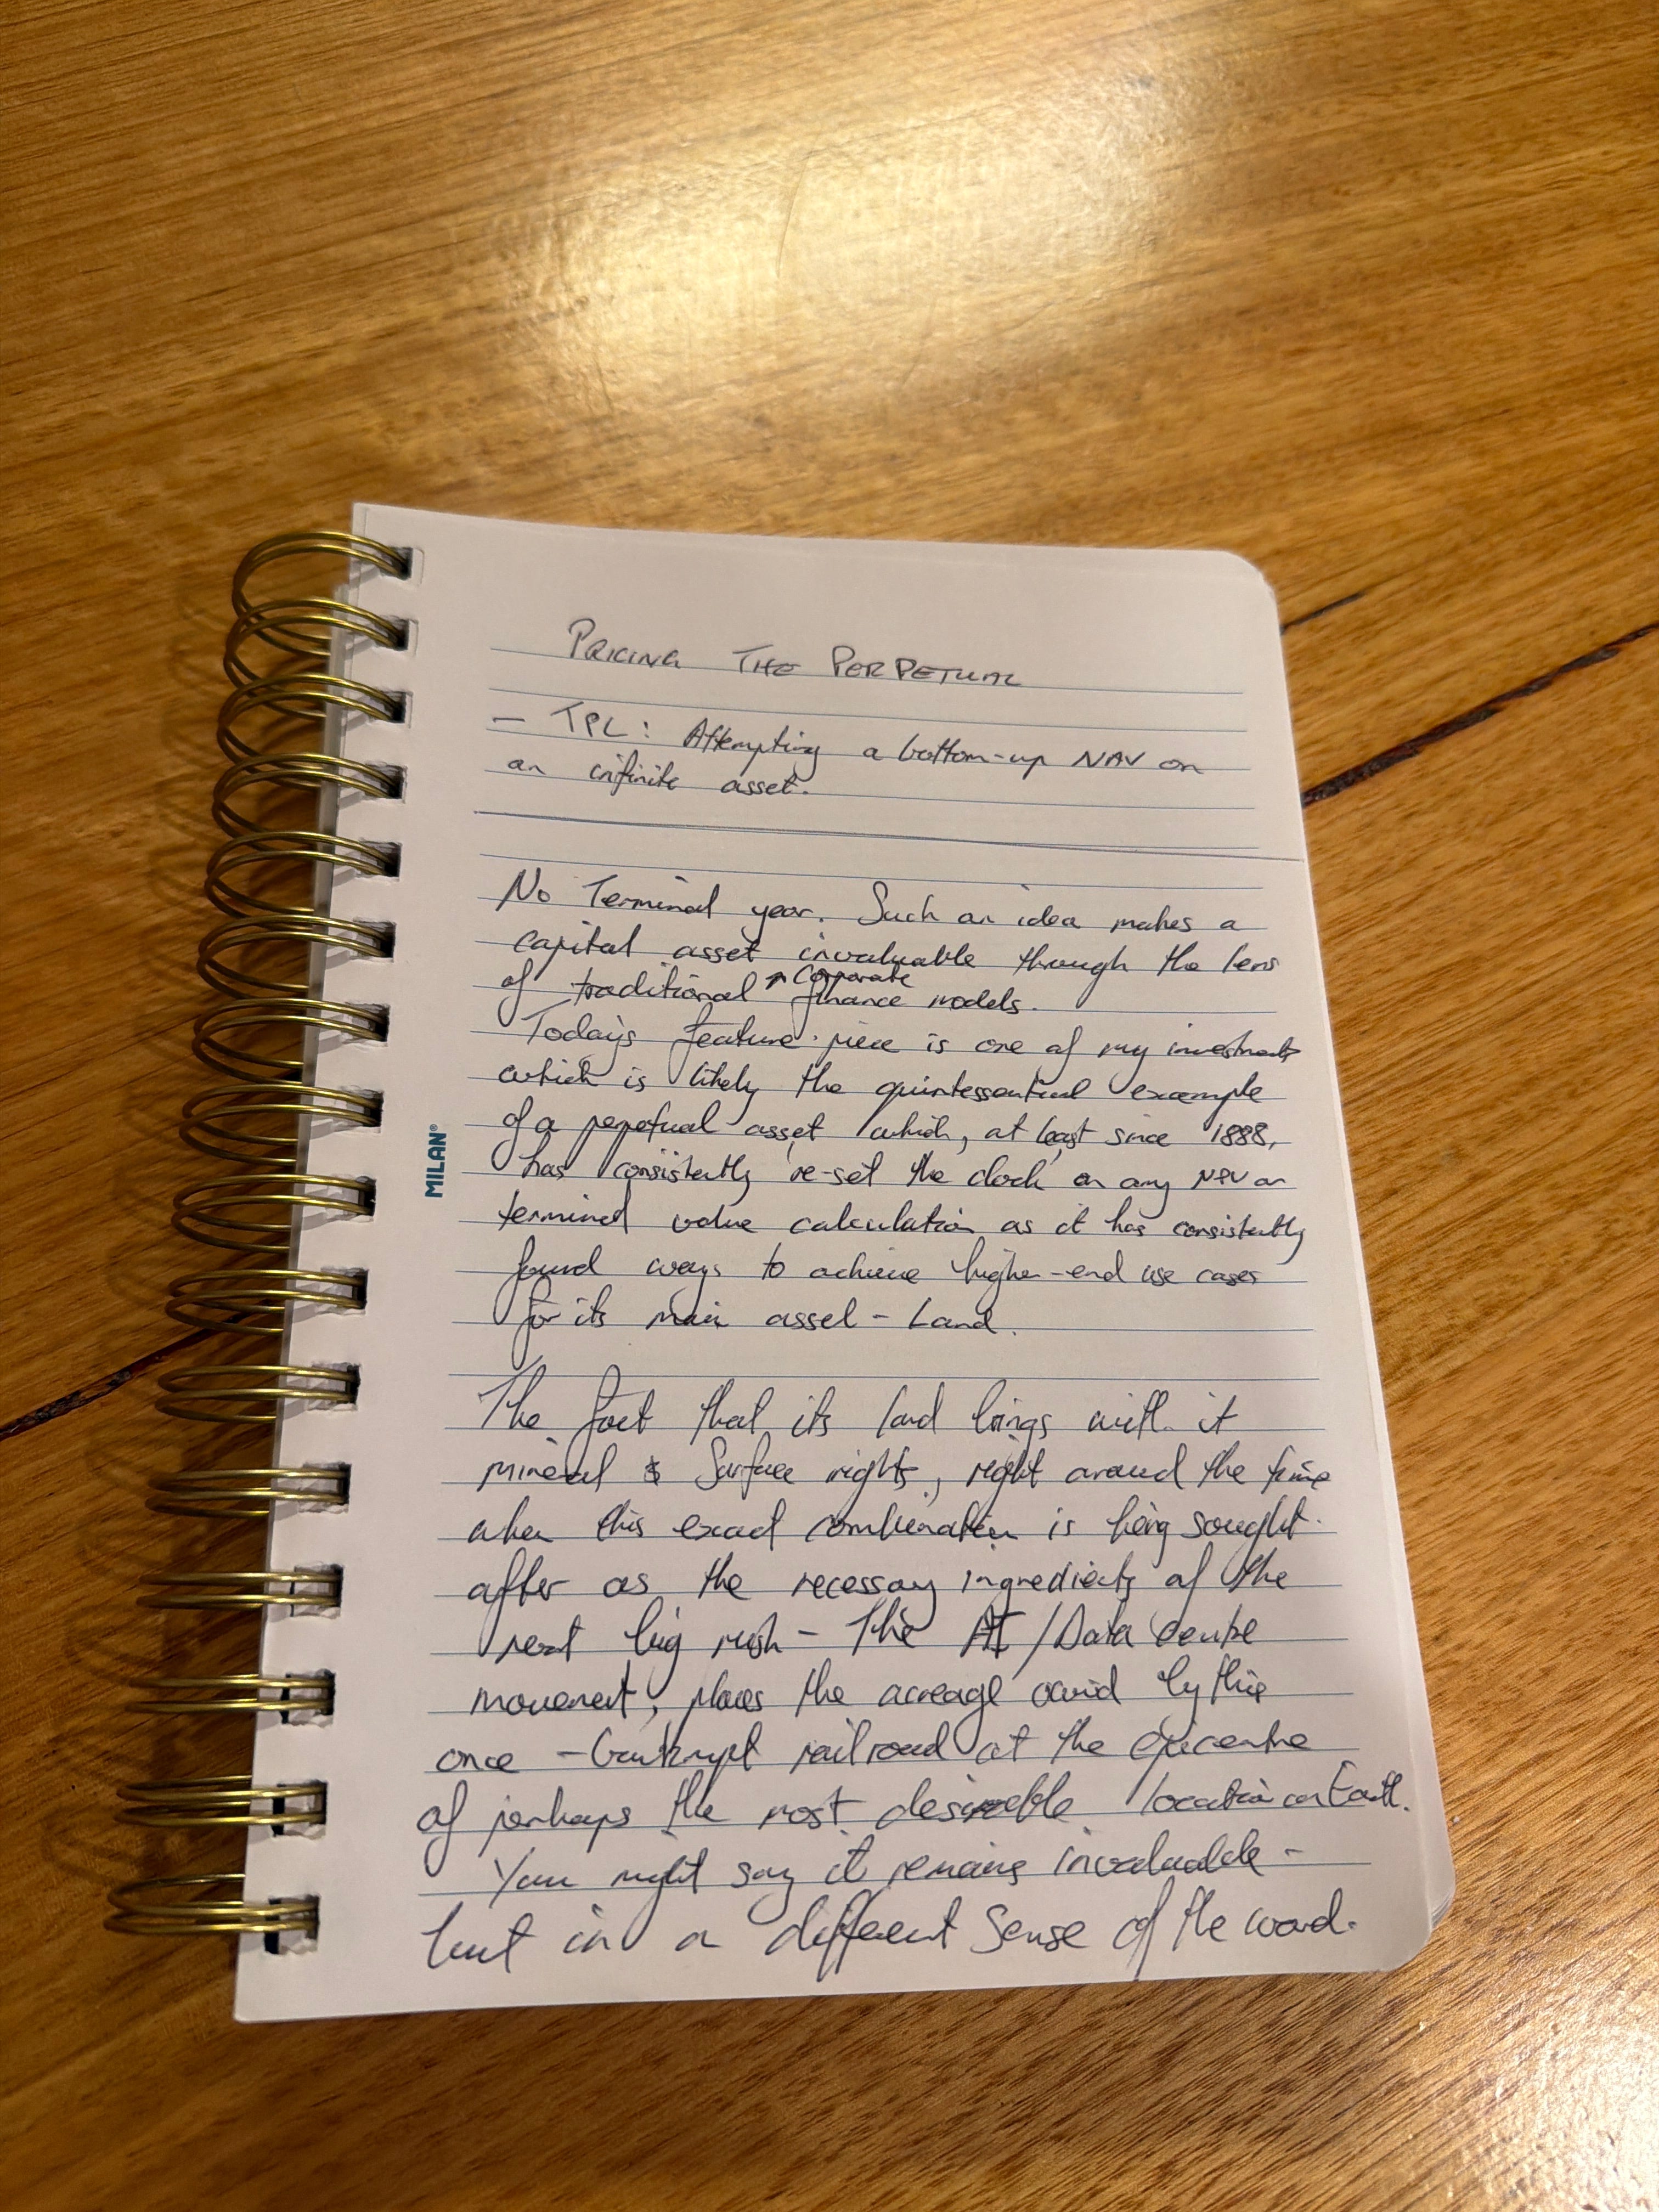
Pricing the Perpetual
TPL: Attempting a bottom-up NAV on an infinite asset.

In Proud partnership with The Solstice Laboratory — the physics of markets, quantified. Read The Entropy Trap to discover what physics knows the economics doesn’t.
No terminal year.
Such an idea makes a capital asset invaluable through the lens of traditional corporate finance models.
Today’s feature piece is one of my investments which is likely the quintessential example of a perpetual asset which, at least since 1888, has consistently “re-set the clock” on any NAV or terminal value calculation, as it has consistently found ways to achieve higher-end use cases for its main asset — land.
The fact that its land brings with it mineral and surface rights, right around the time when this exact combination is being sought after as the necessary ingredients of the next big rush — the AI / data centre movement — places the acreage owned by this once-bankrupt railroad at the epicentre of perhaps the most desirable location on Earth. You might say it remains invaluable — but in a different sense of the word.
Nonetheless, here I leave an honest attempt using a few different methodologies along with my remarks as to the accuracy / appropriateness of each.
By the way, from now on I am writing all my articles free hand, then uploading the photos to AI for transcription. Of course I’ll proof read the drafts but in case something gets lost in the process this may explain any strange typos.
Such a mammoth task is sure to fail in precision. This antipodean author accepts that from the outset, and is comforted somewhat by the words of Uncle Rick who once told me — on the topic of valuation — “You won’t get it right. But you don’t need to, luckily — you just need to get it more right than the next guy.”
Before exploring a number of valuation attempts for the “Grand-daddy” Royalty Co., a brief recap on this mineral-estate, because that’s a better lexical item to understand it; certainly better than “stock,” “business” or “operator.”
Executive Summary
Texas Pacific Land is not an oil producer. It is a perpetual royalty + surface + water enterprise on ~881,000 surface acres and ~224,000 net royalty acres in the core of the Permian Basin — the purest expression of our "who gets paid" framework in North American energy. Zero debt, $248M cash, an 86% EBITDA margin, and super-major operators carrying every dollar of development cost.
The Business — Four Tolls on the Best Oil Basin on Earth
Oil & Gas Royalties — 52% of revenue
Perpetual non-participating royalty across ~224,000 net royalty acres production volume grew 8.8→34.6 mboe/d ('18–'25).
Produced-Water Royalties — 16% of revenue
A volumetric fee on water disposed across TPL's surface — capex-free. Delaware wells produce ~4 barrels of water per barrel of oil and the ratio rises with field age, so this is a structurally growing annuity (volume 433→4,292 mbbl/d since '18) tied to drilling, not directly to price.
Water Sales — 21% of revenue
The one genuinely operating aspect: the largest source-water network in the northern Delaware. ~71% segment margin; volume mature (+4% in '25) but pricing strong (+16.7% YoY). Scaling cash engine.
SLEM — Surface Leases, Easements & Materials — 11% of revenue.
Easements and commercial leases with ten-year terms renewing at the greater of 115% or CPI — a quietly compounding, inflation-protected annuity (~+1.4% real per renewal cycle). $250M+ of renewal value sits in 2026–2035 before any next-generation use.
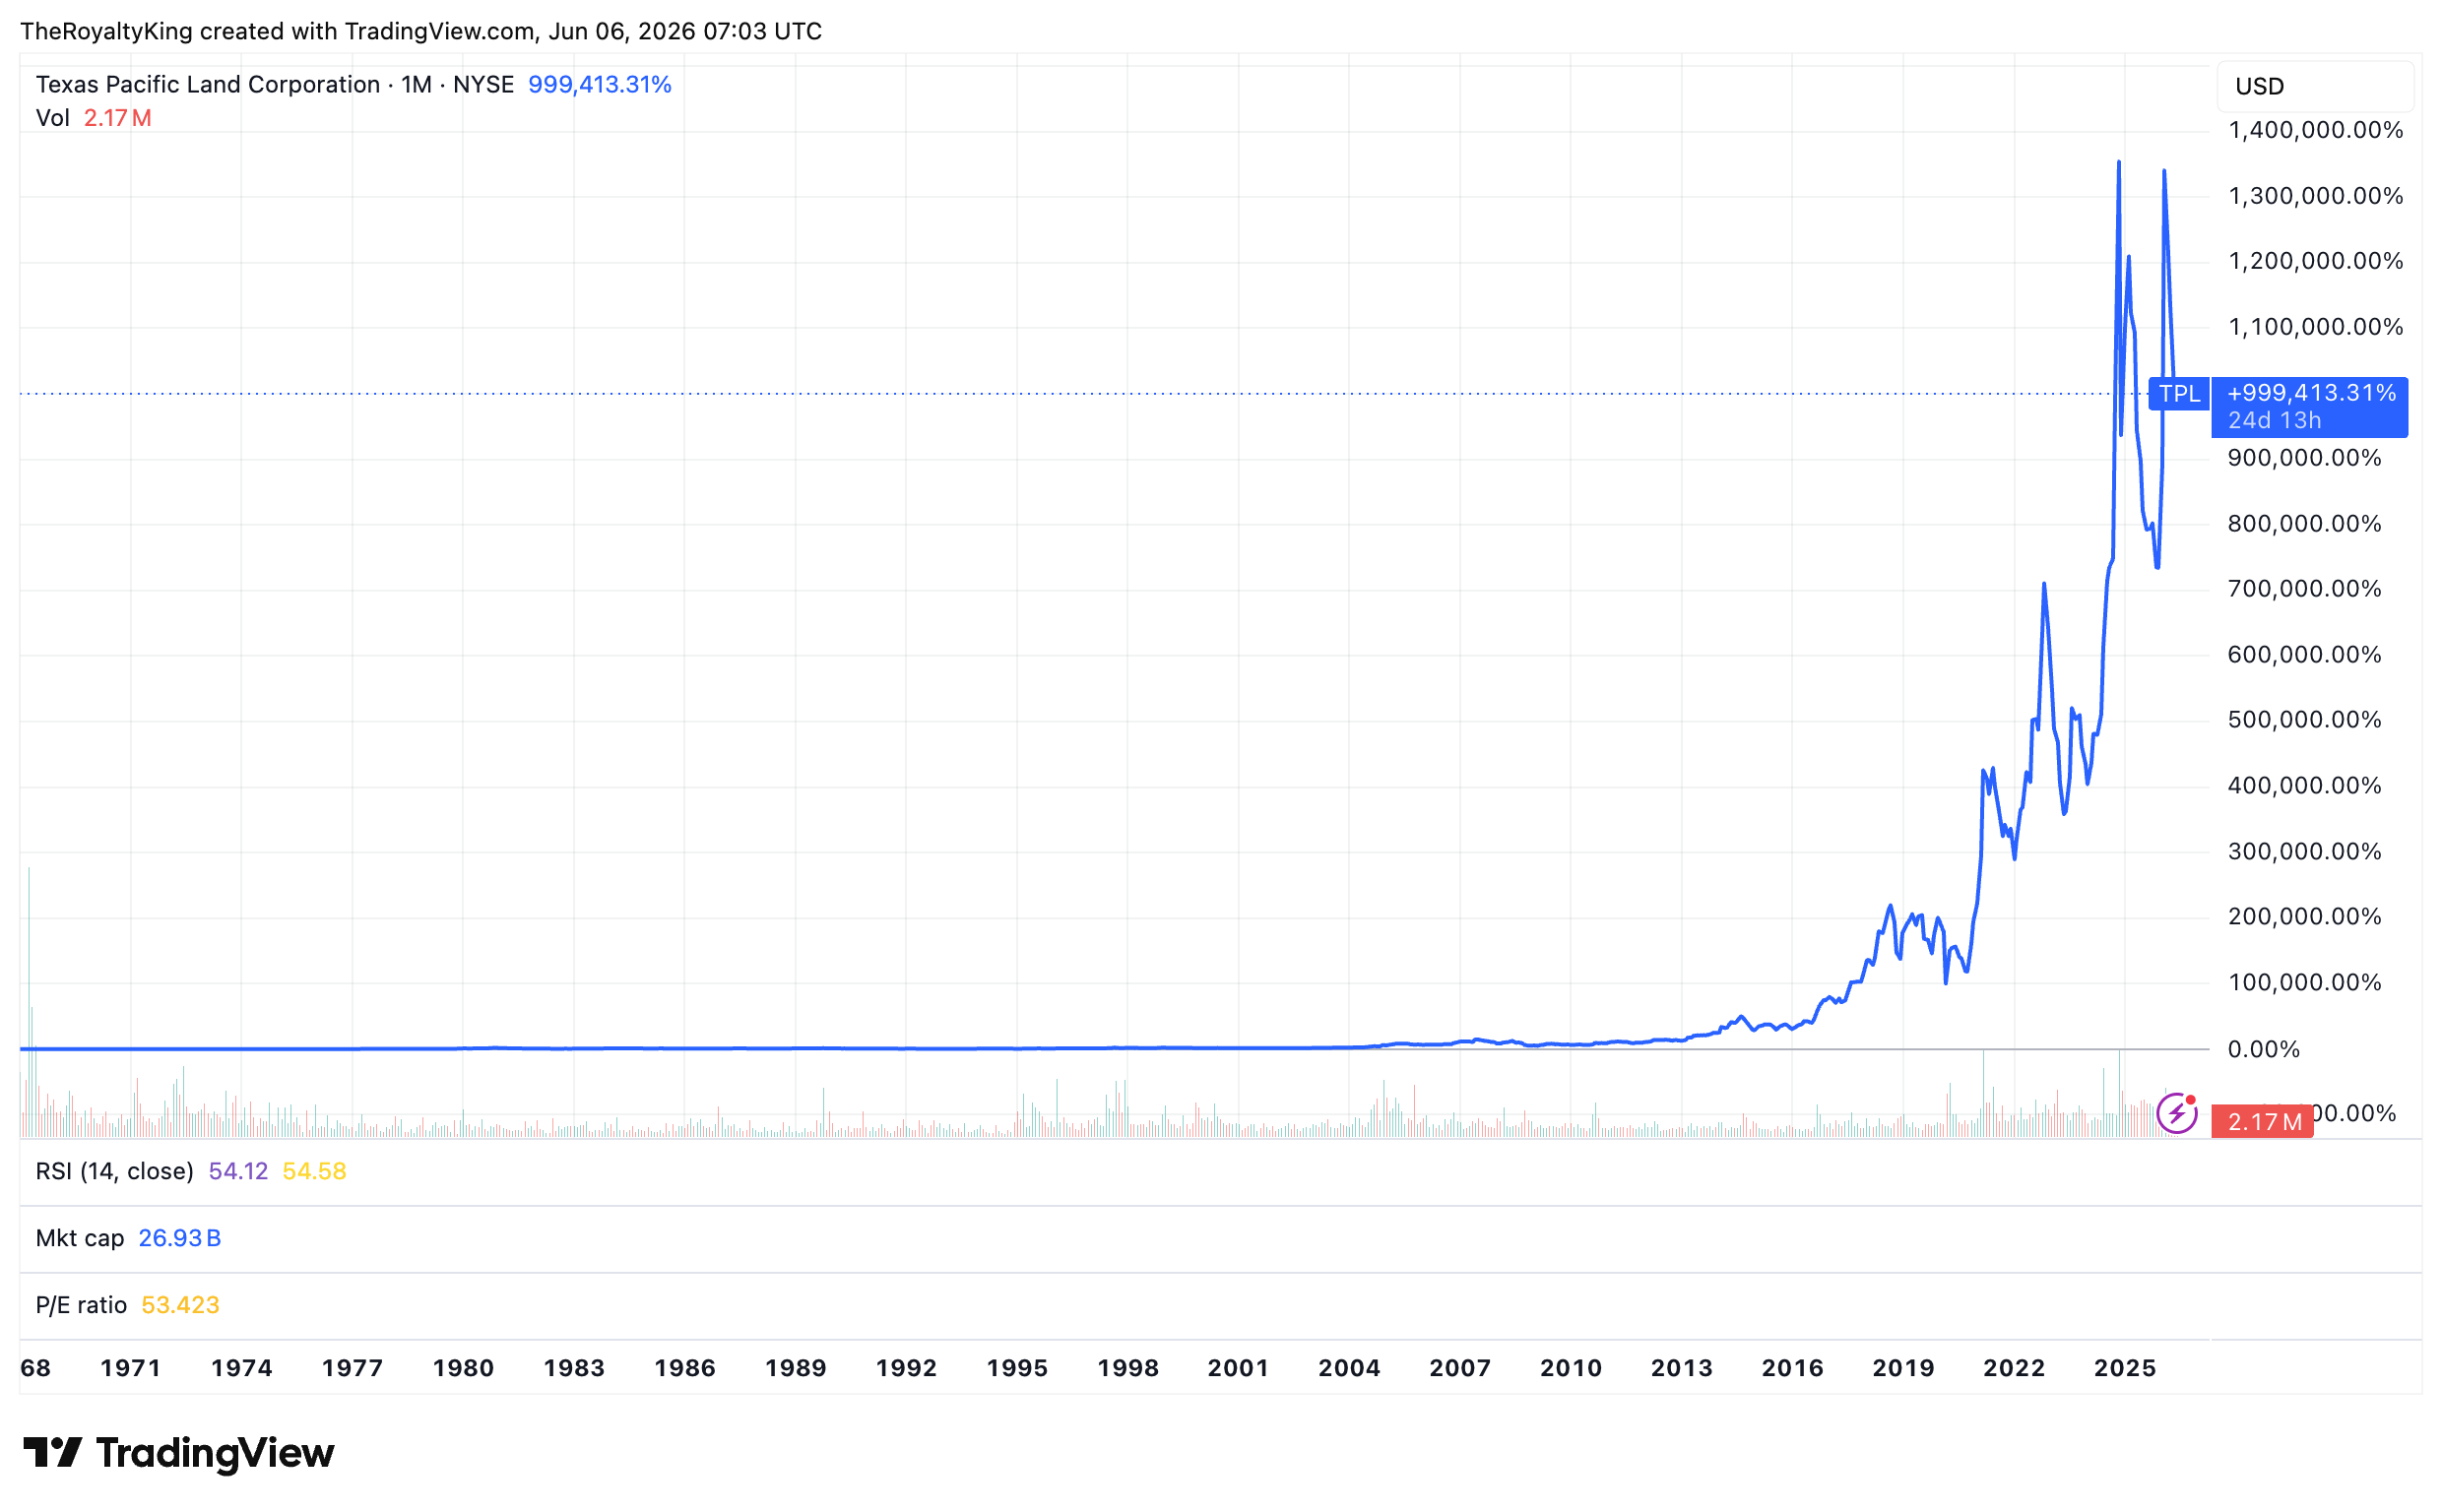
TPL, and its 881,000 acres of land in the Permian, are the result of a failed attempt to build a railway connecting Texas and California. The endeavour ended in bankruptcy, whereby the land was placed in a trust, the TPL trust, in 1888 — and for the next 130 years the trust did well, not much aside from lease its land and occasionally selling some acres — the proceeds of which were used to buy back shares.
This is not a minor point. In fact, it beautifully highlights how some assets and business models provide superior returns on capital in the fullness of time — as illustrated in the below chart.
Assets — that’s the key word. Because prior to 2016 TPL really didn’t actively manage or seek to maximise their various royalty fees.
RETURN / CAPITAL
TPL's main asset, land & mineral [+ water] rights, organically grow in value over time; though as from simple grazing leases to mineral royalties to commercial & residential real estate development to now data centres, this ascension up the value chain naturally increases the numerator (the return) without much effort or innovation from TPL and — critically — no commensurate increase in the denominator: the capital.
In fact, if the concept is viewed as Return on Capital, Stock or Equity, TPL’s astonishing returns are explained via the power of a naturally increasing numerator and an actively shrinking denominator.
This, in part, is what makes trying to put a number on TPL’s per-share value befuddling. When will the earnings roll-over? When will the Basin run-dry? One question will likely have little to do with the other, as TPL seems to find a new use-case for its assets every few decades, thereby effectively re-setting the clock on the Net present value (NPV) of its earnings.
As a result, using the NPV or DCF method isn’t ideal.
But equally unhelpful is that oft-cited figure PE or Price to Earnings.
Due to the fact that “earnings aren’t earnings.” There does exist a qualitative factor to earnings that is almost universally ignored by buy-side analysts.
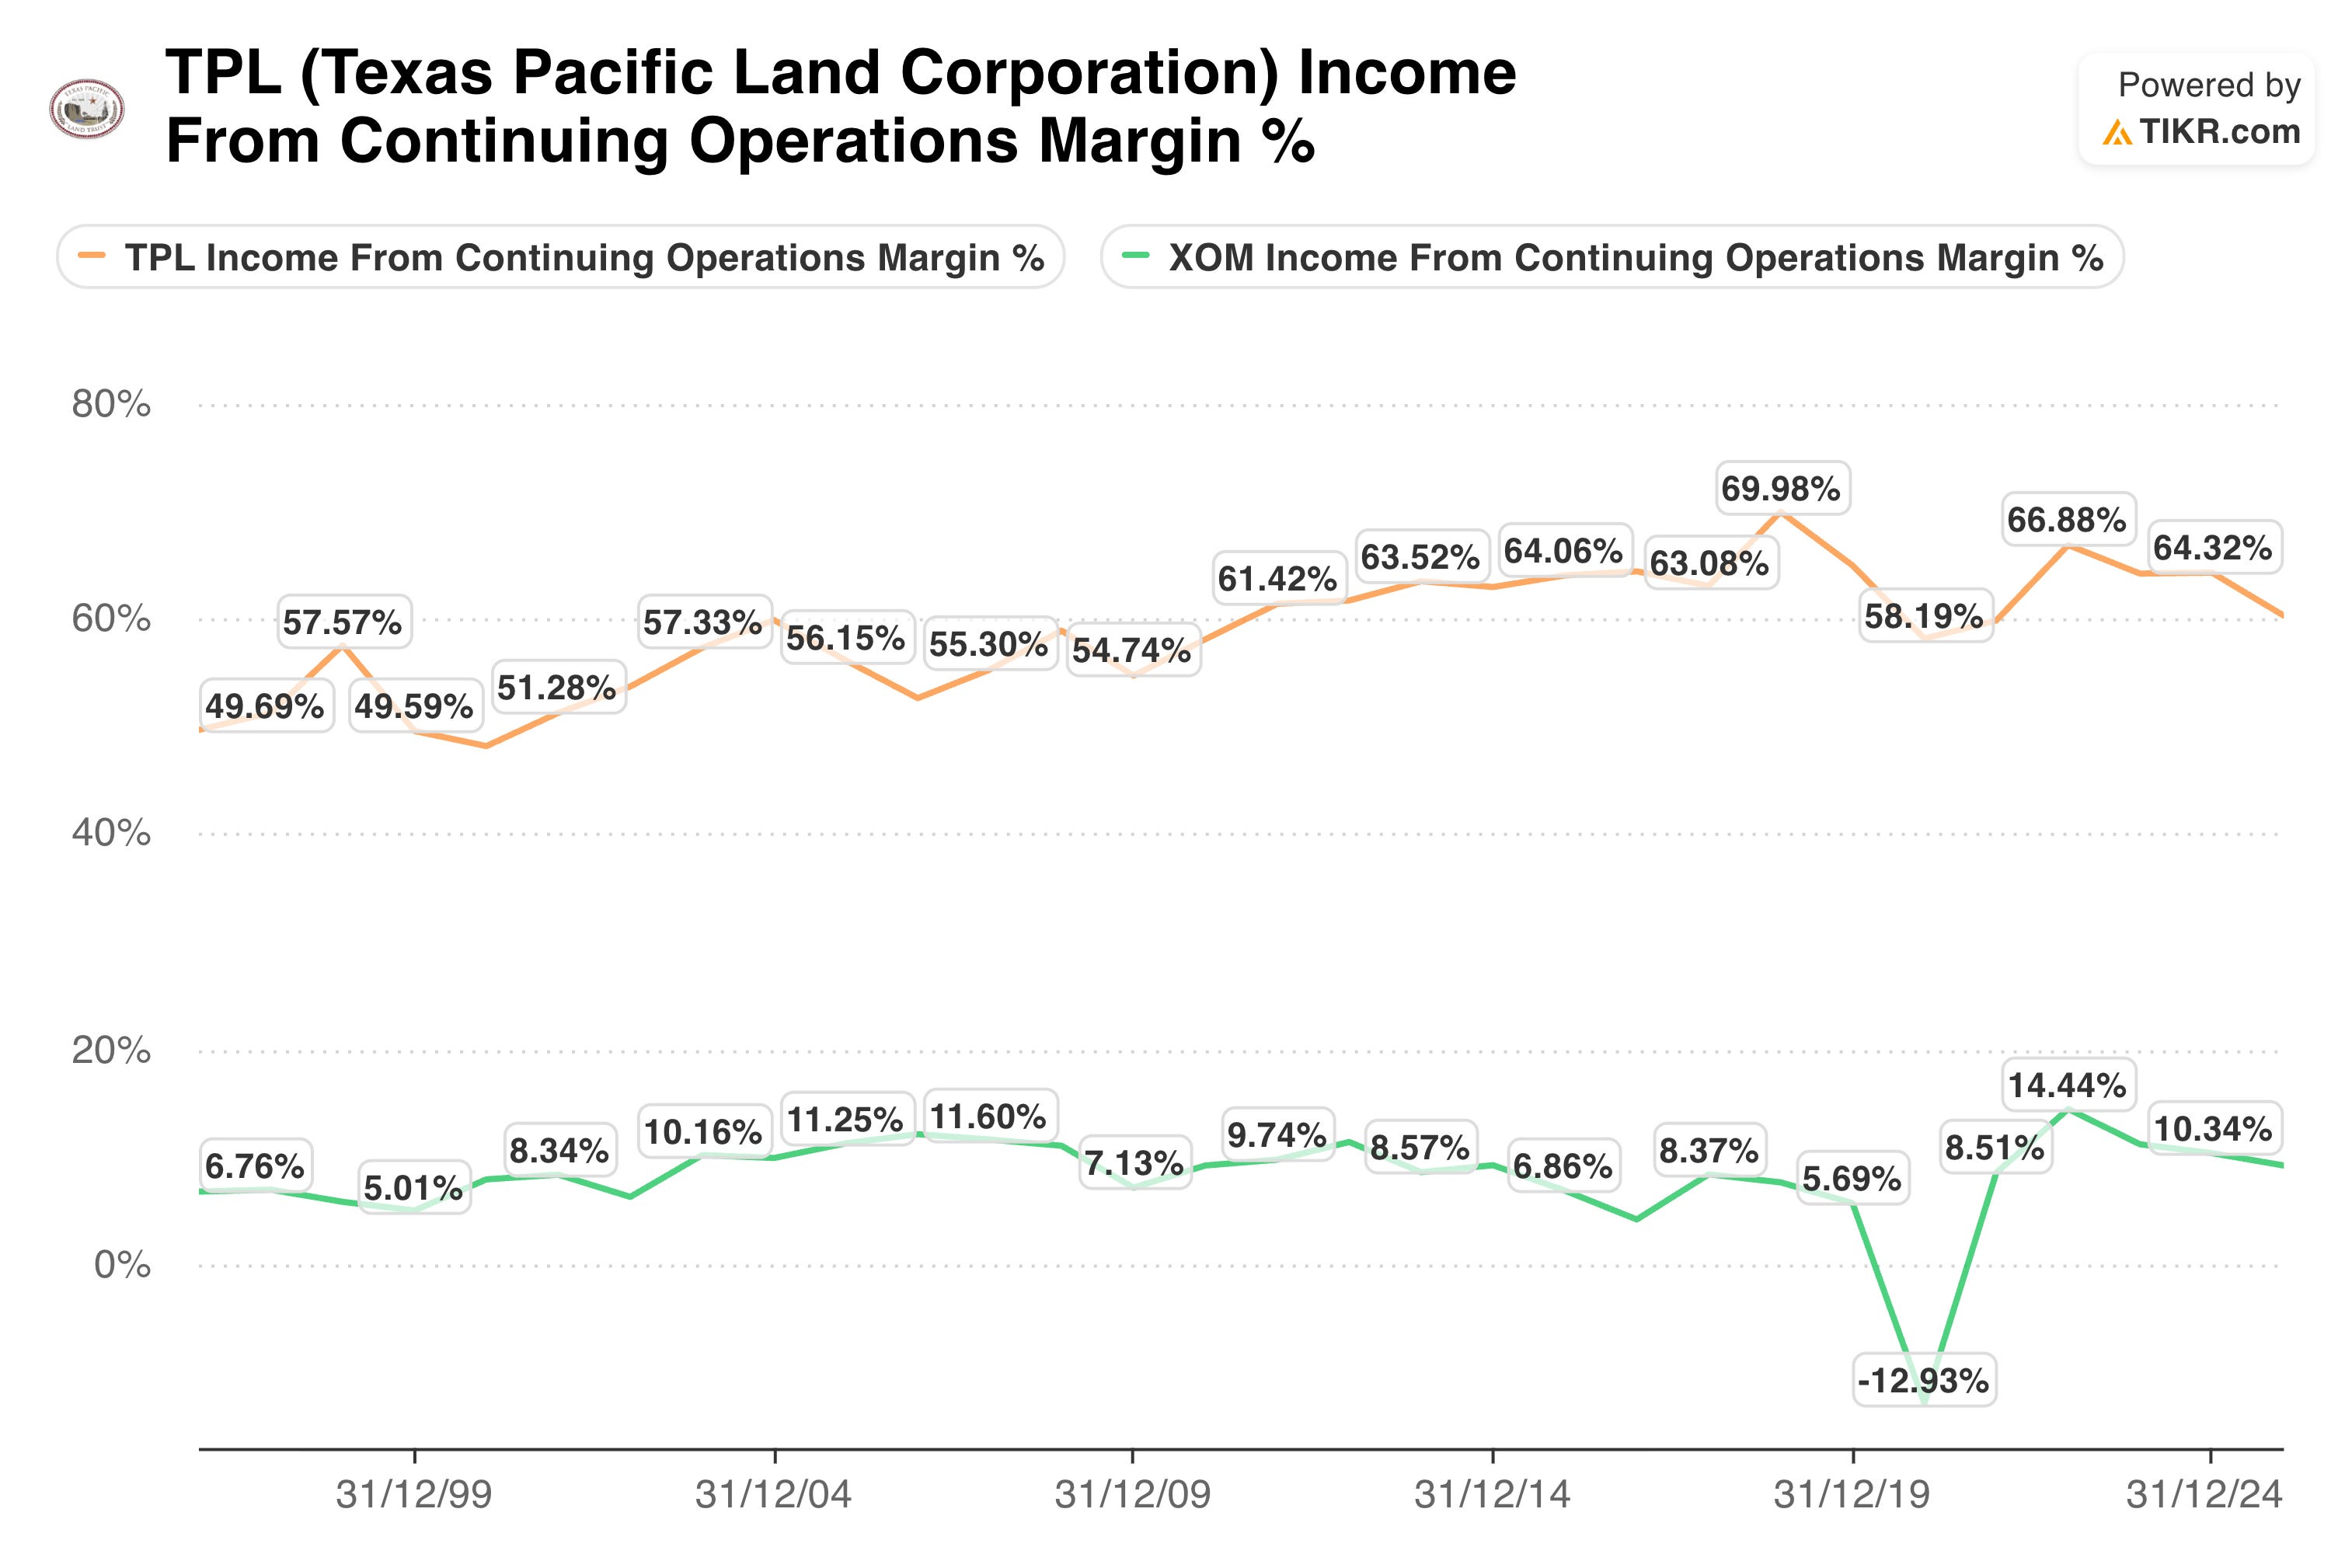
Most apparently struggle with this concept let’s explore a simple example visually.
Imagine Company A has an average (and repeatable) net earnings margin of 59% compared to that of company B which is 7.7%.
In other words; for every $1 of earnings company A’s shareholders enjoy 59 cents free and clear, whereas company B — due to capital reinvestments required to run and grow the business — only leaves 7.7 cents for its shareholders after all costs are accounted for.
Intuitively, it’s not challenging to grasp that Company A’s earnings at 54% net margin are worth more than $1 in earnings each $1 of Company B whose margin is 7.5%.
Yet, this is absent discussion when experts scan across the universe of various companies and simply compare one PE ratio to another without consideration for the % of said earnings that can be enjoyed by the investor.
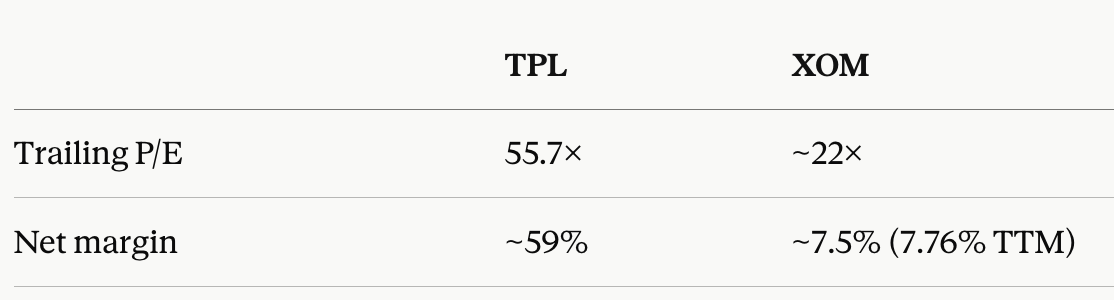
It never ceases to amaze me how many experts would consider Company B “obviously much cheaper / better value” trading at 12.8× vs Company A at 60× fwd EPS, without considering that — all else being equal — the margin ratio above would actually expect a P/E of 101× for A, when calibrating for earnings quality or how much of the earnings actually reach an investor.
The relevance?
* Company A is TPL and B is XOM, using latest figures.
As polemic as this idea is perceived, let us press further into the incredulity the reader is likely experiencing.
One can reframe the above numbers through a number of different lenses using mathematical ratios.
Method 1 — P/E per margin point: TPL: 55.7 / 59 = 0.945× XOM: 22 / 7.5 = 2.93×
Lower = cheaper per unit of earnings calibrated for quality.
Method 2 — Calibrated P/E: At XOM's pricing, margin-parity would put TPL at 22 × 7.87 = ~173×. TPL at 55.7× or at 32% of margin-adjusted parity — a 1 : 3.1 ratio.
The above is not intended as a comment on the attractiveness or lack thereof of TPL’s headline PE ratio, but rather an illustration of how inappropriate it is to compare two sector ‘peers’ superficially via their headline PE and conclude one is automatically cheaper/more expensive than the other.
Our excursion thus far has hopefully impressed upon the reader that trying to attain a reasonably accurate valuation for such an asset is far more complex than it first appears & is unlikely to be achieved by this attempts to force TPL’s financials through a procrustean bed of standard corporate finance models.
Yet the question remains: How then should TPL be valued?
The answer is simple in theory: Build a bottom-up NAV for every aspect of the business then apply a reasonable growth factor (Which is not so simple thanks to the perpetual nature of the assets as mentioned).
Harder in practice and certainly to make me look foolish with time. Nevertheless here’s my take:
