
Water Is The Hidden Constraint Nobody Is Pricing In The Data Centre Arms Race.
The Royalty King Research Report — Water Infrastructure Series

*Author’s Note* The Raw study without commentary is available in PDF:
Data Centres, Water, and the Next Infrastructure Bottleneck
The prevailing view in markets is that the binding constraint on the AI buildout is electricity. Gigawatts of generation capacity, grid interconnection queues, transmission infrastructure, fuel substrate etc. These are the terms of the investment debate. Power, in this framework, is considered the scarce resource in this modern-day race to secure electrons.
This view is not wrong, but I contend incomplete and the dimension in which it is incomplete (water needed for said power generation) has consequences for project economics that are not remotely reflected in current market pricing.
The purpose of this report is to establish the full water demand picture for hyperscale data centre infrastructure, then attempting to model the specific case of a 1 GW campus in the Permian Basin of West Texas.
The sourcing problem is more acute than most operators publicly acknowledge and it appears the investment community’s continued reliance on a single, deliberately incomplete metric: on-site Water Usage Effectiveness (WUE) has produced a systematic blind spot that will likely to eventually be corrected by the market in the customary painful fashion.
Part I: The Scale of the Problem
Water consumption in a data centre occurs across three distinct systems:
The power generation plant supplying the centre’s electricity
The data centre cooling infrastructure
Backup and redundant generation
It is a peculiarity of current reporting practice that the first of these systems,the power plant, which in almost all thermal scenarios accounts for 50 to 70 percent of combined consumption, receives little-to-no mention in operator or broad market commentary.
This author can only surmise that this is due to the fact that WUE, as defined and disclosed by the data centre industry, covers only on-site water consumption. Investors who evaluate data centre water risk solely on disclosed WUE figures are evaluating, at best, 30 to 50 cents of every dollar of water consumed on their behalf.
Before attempting to calculate the entire picture of our 1GW model, let’s get some macro context on where the industry is heading in the USA.
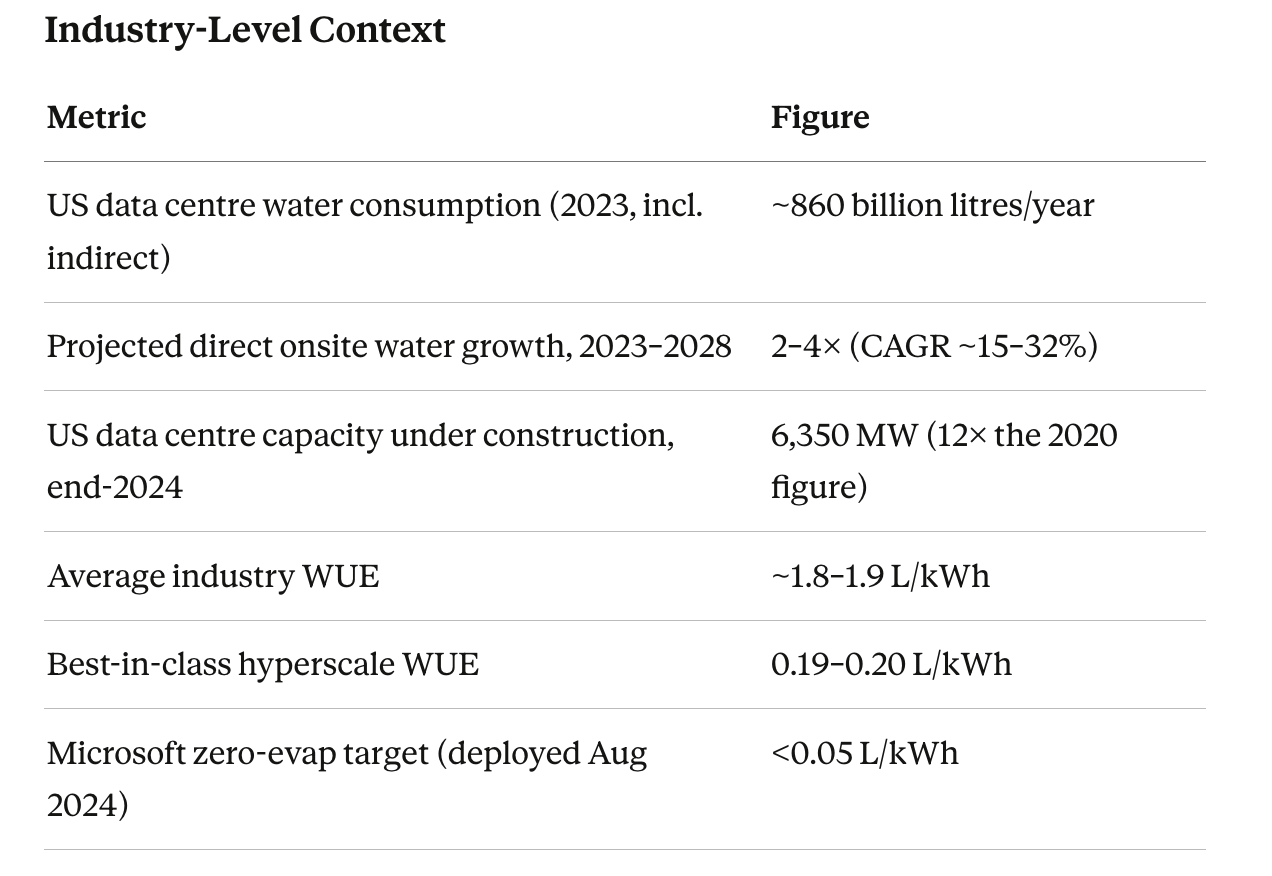
For perspective: a medium-sized 15 MW data centre uses as much water as three average hospitals, or more than two 18-hole golf courses, per year. Now let’s appreciate that these facilities are now being built at 1,000 MW and above.
Withdrawal vs. Consumption: A Critical Distinction
When reading the available research it was found that these two terms are used interchangeably in most infrastructure writing yet they should not be.
Withdrawal — total water drawn from a source. Most is returned to the environment, though often at higher temperature or altered chemistry.
Consumption — water permanently removed from the local water cycle, primarily through evaporation. For wet cooling tower systems, ~80% of withdrawn water is evaporated and permanently lost; the remaining ~20% is discharged as blowdown.
Another thing to note is that withdrawal represents a one-time fill. It does not. The cooling tower evaporates roughly 1–3% of its circulating volume with every pass, and make-up water is drawn continuously year-round. Withdrawal is a perpetual annual operating cost, analogous to a fuel cost rather than just a capital input.
All consumption figures in this report use the evaporative loss definition. Withdrawal figures are provided throughout for infrastructure sizing, because sourcing, treatment, and pipeline costs are incurred on the full withdrawal volume — not only the fraction that evaporates.
Part II: Power Plant Water & DC Colling Requirements
The choice of power generation technology has consequences for total water demand that dwarf the consequences of data centre cooling technology selection. The numbers:
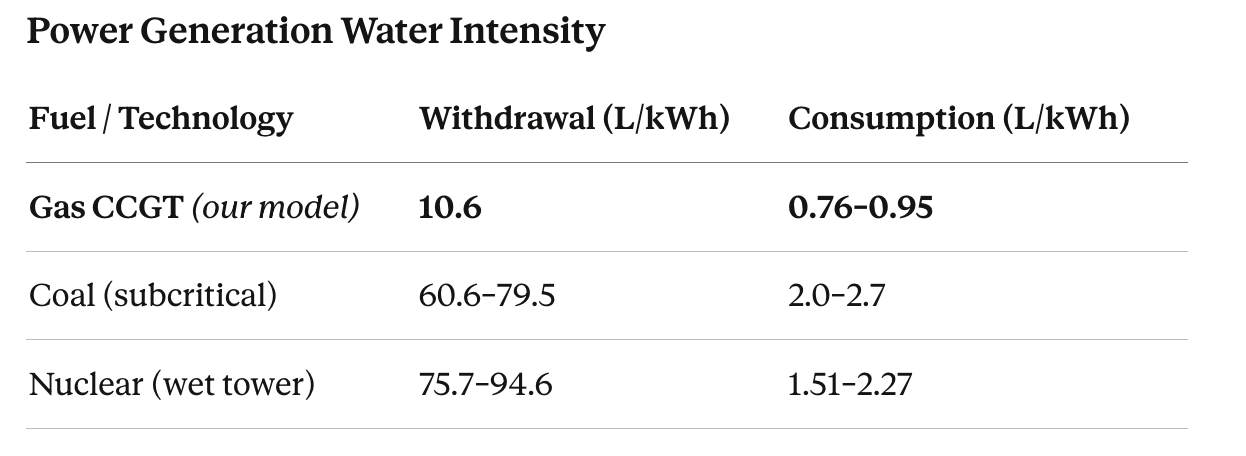
Source: US EIA Power Plant Operations Report; River Network 2012; World Nuclear Association.
Gas CCGT appears the most water-efficient thermal generation option by a significant margin which is why it is the assumed power source for the Permian Basin model (additionally there’s an abundance of cheap gas out there!). Dry cooling (air-cooled condensers) can reduce power plant water consumption by ~90%, at the cost of power efficiency, but the environments that support it rarely coincide with the other prerequisites for a hyper-scale campus.
Now that a guide for the main power plant figure has been estimated, let’s examine the cooling requirements for the DC itself, before considering that additional power and by extension water requirements must be anticipated to satisfy practical criteria to achieve the 1 GW working model in Pt 3.
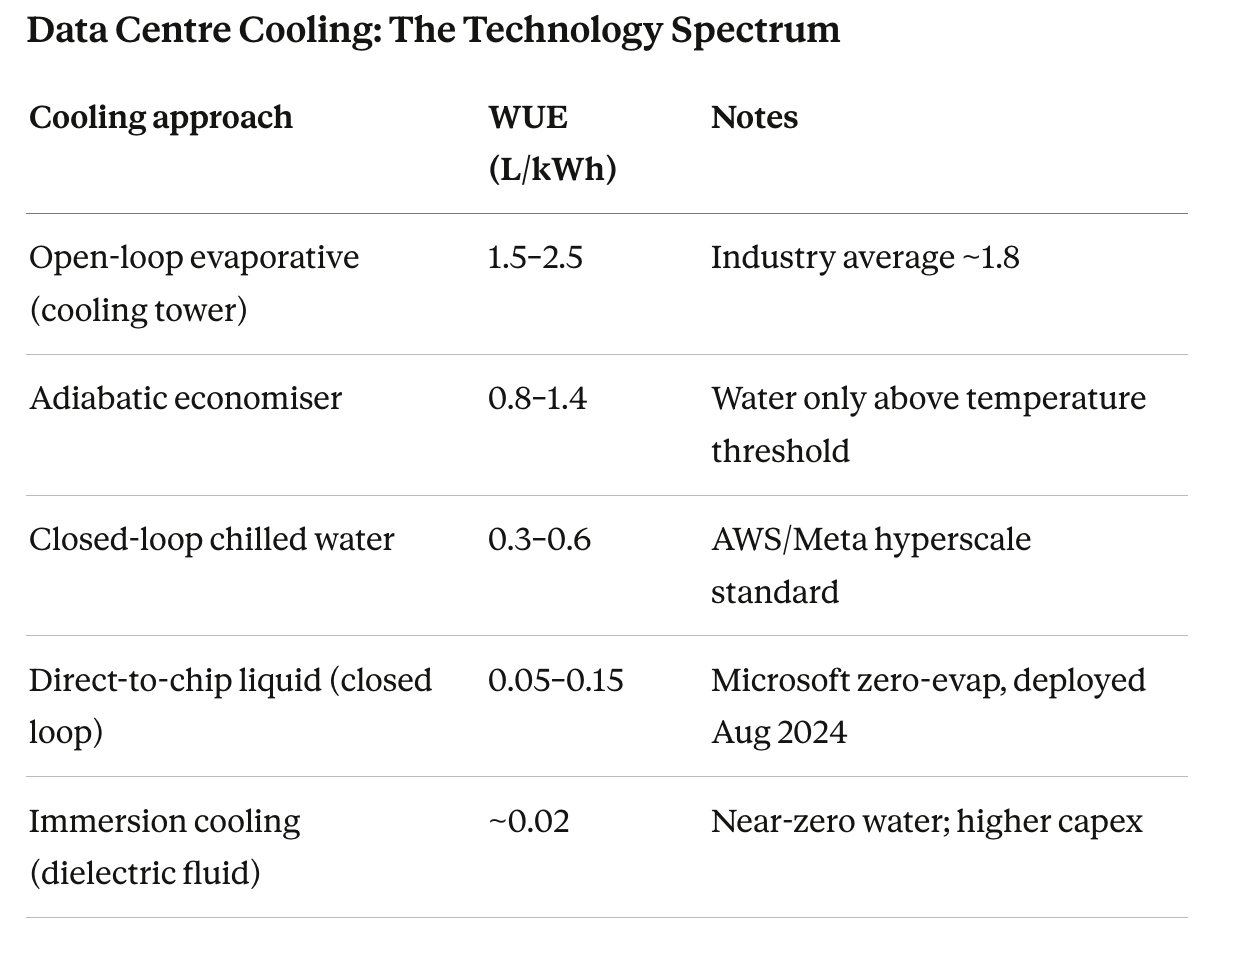
These advances in data centre cooling are genuine and material. They are also largely irrelevant to the total water question, because the power plant dominates in every scenario and is unaffected by what happens to cooling technology inside the server racks of the DC.
Part III: The Model — Applying Theory To A 1 GW Hyperscaler In The Permian
Why the Permian Basin?
Firstly, a 1 GW IT-load hyper-scale campus in the Permian Basin is not a hypothetical. Chevron’s planned data centre power complex is sized at 2.5–5 GW of generation for a single client. Pacifico’s GW Ranch Project in Pecos County targets 7.65 GW which is the largest approved in the United States at time of writing. It in turn is expected to be eclipsed by BOLT Data’s 10 GW planned project in West Texas. The 1 GW working model that follows is a intended as a scalable starting point.
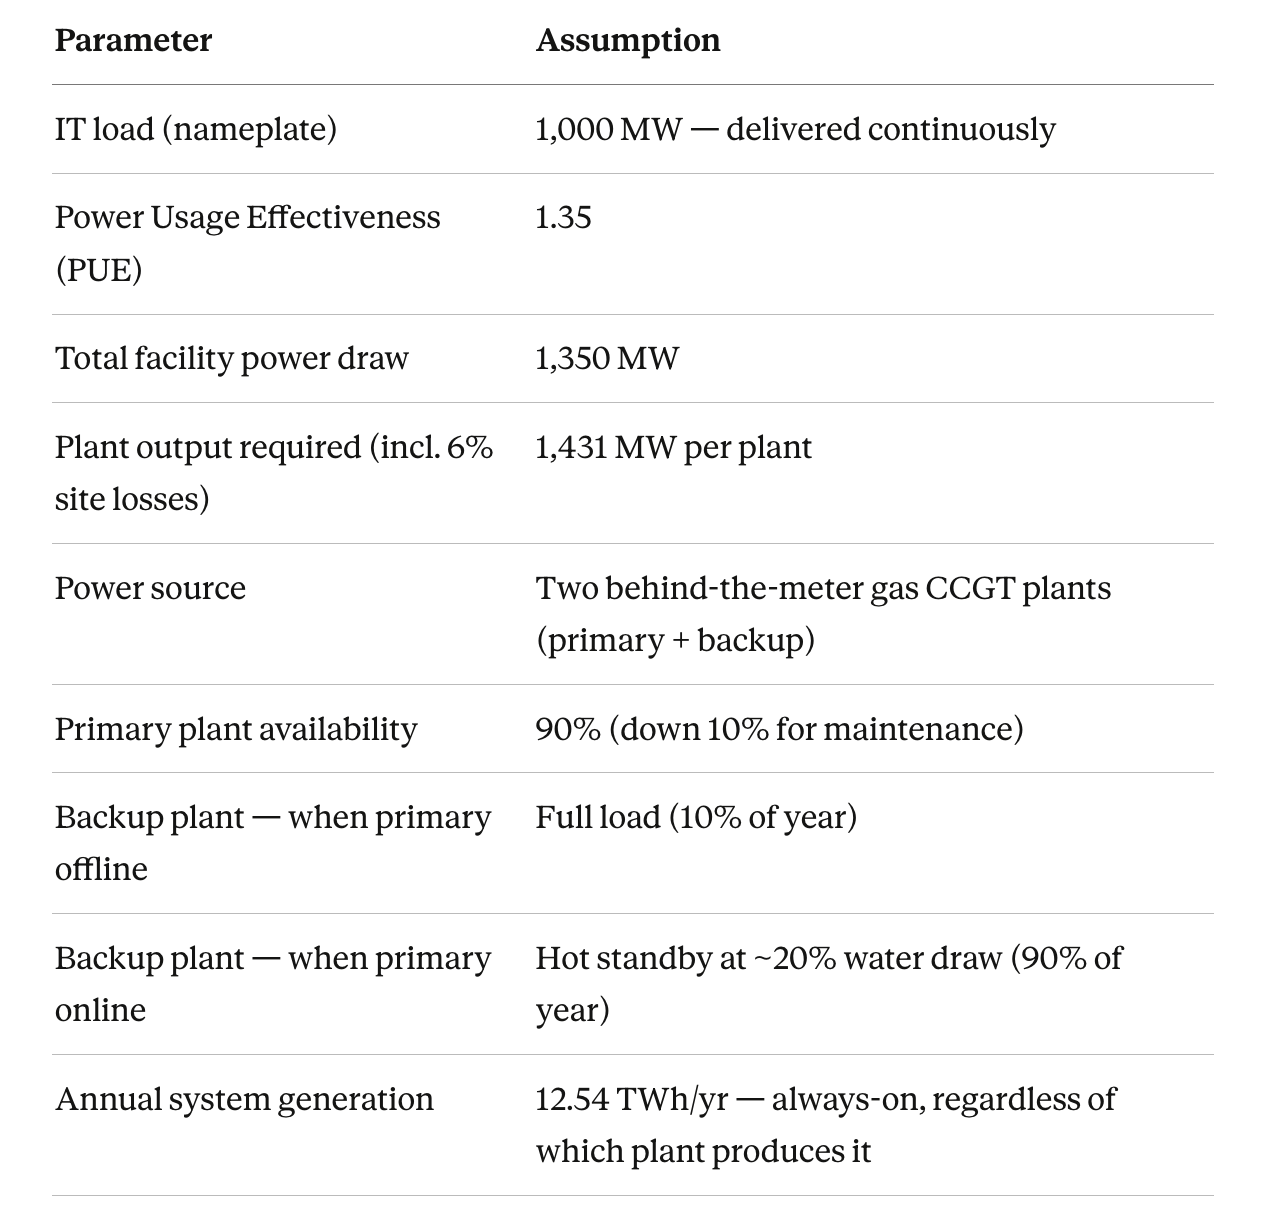
Key model logic: The data centre sells and delivers 1 GW of compute at all times. The 90% figure is primary plant availability, not system output. When the primary is offline, the backup takes full load. All water volumes are calculated on this basis. Other analysts contend differently i.e that not a second of downtime would be acceptable ergo a second back up power plant would need to be on standby at all times. Others also estimate PUE more towards 1.58 or above. The salient point is that my model can be considered on the conservative side of water and power consumption that will ultimately be needed - which is somewhat incredible given the outputs I’ve estimated are eye-brow raising in and of themselves.
Power Plant Water Demand: Two-Plant Model
Water intensity: CCGT withdrawal 10.6 L/kWh; consumption 0.86 L/kWh (midpoint of EIA range)
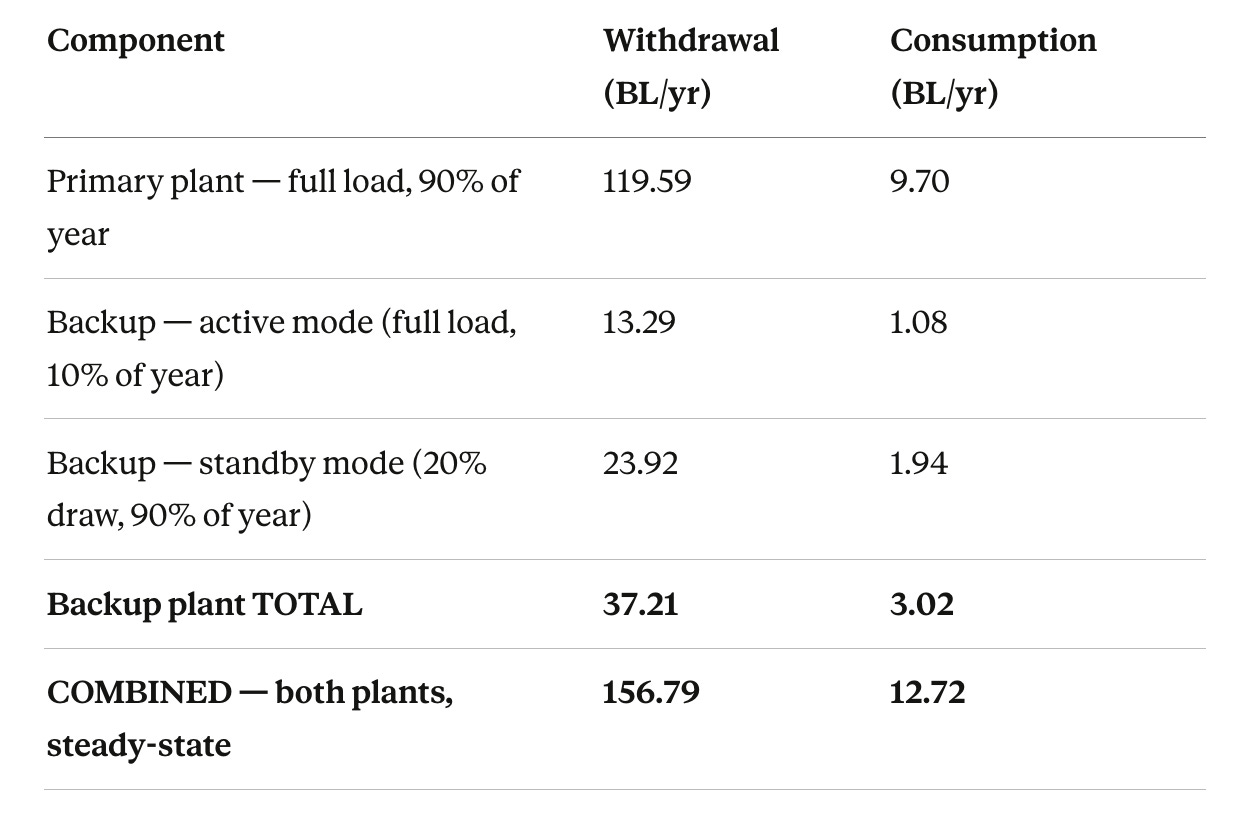
BL = billion litres = 1 million m³. Returned/discharged combined: 144.07 BL/yr.
The standby figure warrants particular attention. A CCGT in hot standby i.e gas turbine turning, heat recovery steam generator warm, steam pressure maintained consumes approximately 20% of its full-load water withdrawal continuously, even while generating no useful electricity. For this 1.43 GW backup plant, that equates to 23.92 BL/year of withdrawal and 1.94 BL/year of permanent evaporative loss simply to keep the plant ready.
This is not optional. A CCGT cold restart requires 4–8 hours — incompatible with data centre uptime requirements. Hot standby, with its associated water draw, is the minimum credible standby mode for a mission-critical facility.
Data Centre On-Site Cooling: Scenario Analysis
Annual IT energy on nameplate basis: 8.76 TWh/year
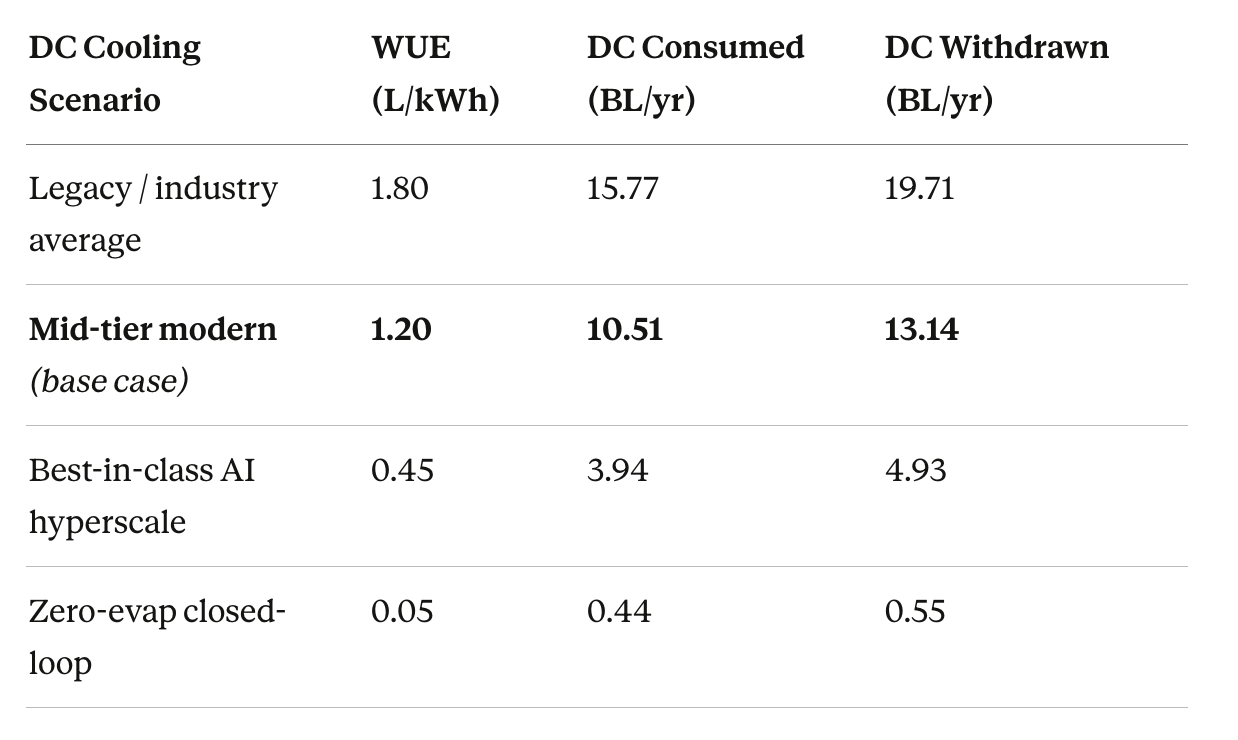
The mid-tier base case (WUE 1.2 L/kWh) is retained as a conservative planning assumption given the source water purity questions addressed in Part IV. A new-build AI hyperscale in 2026 might achieve WUE 0.15–0.45, placing it between the best-in-class and zero-evap scenarios above but the operator would need to be up for a higher grade of water.
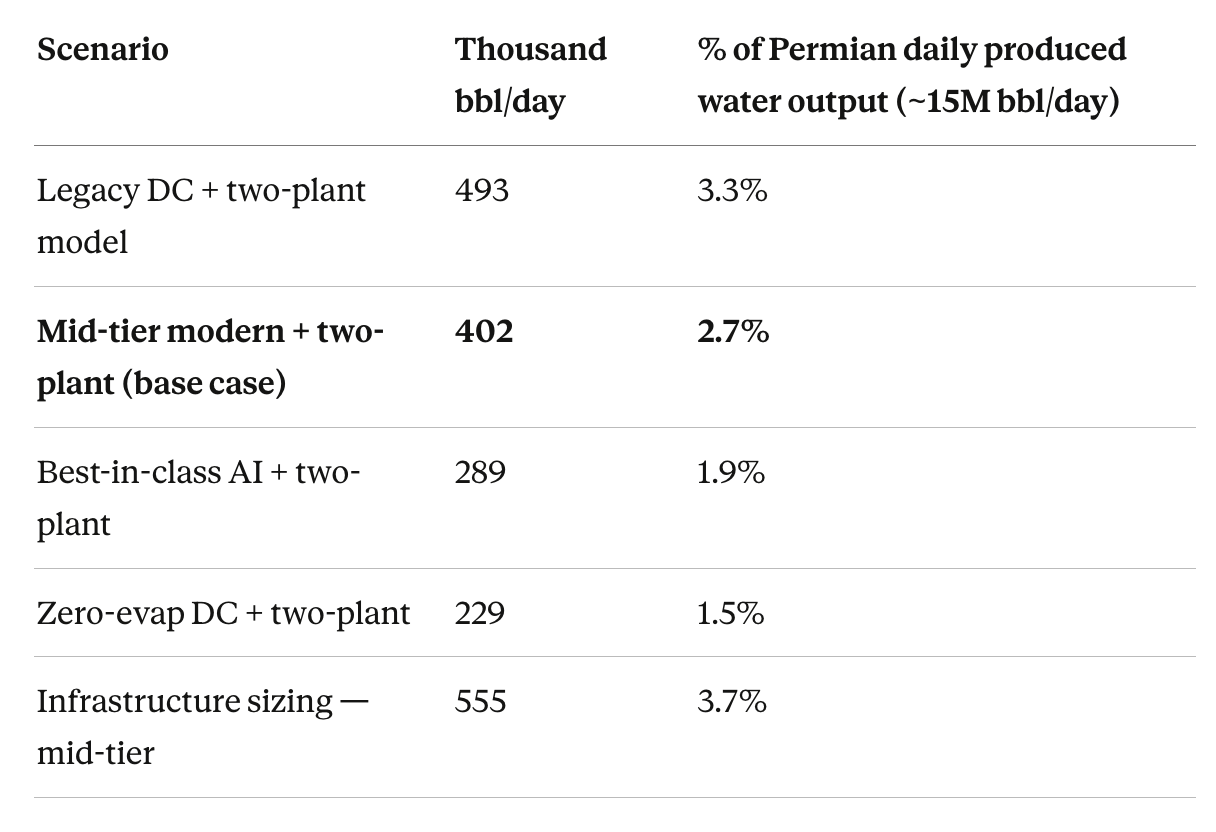
The Three Scenarios That Drive Different Investment Questions
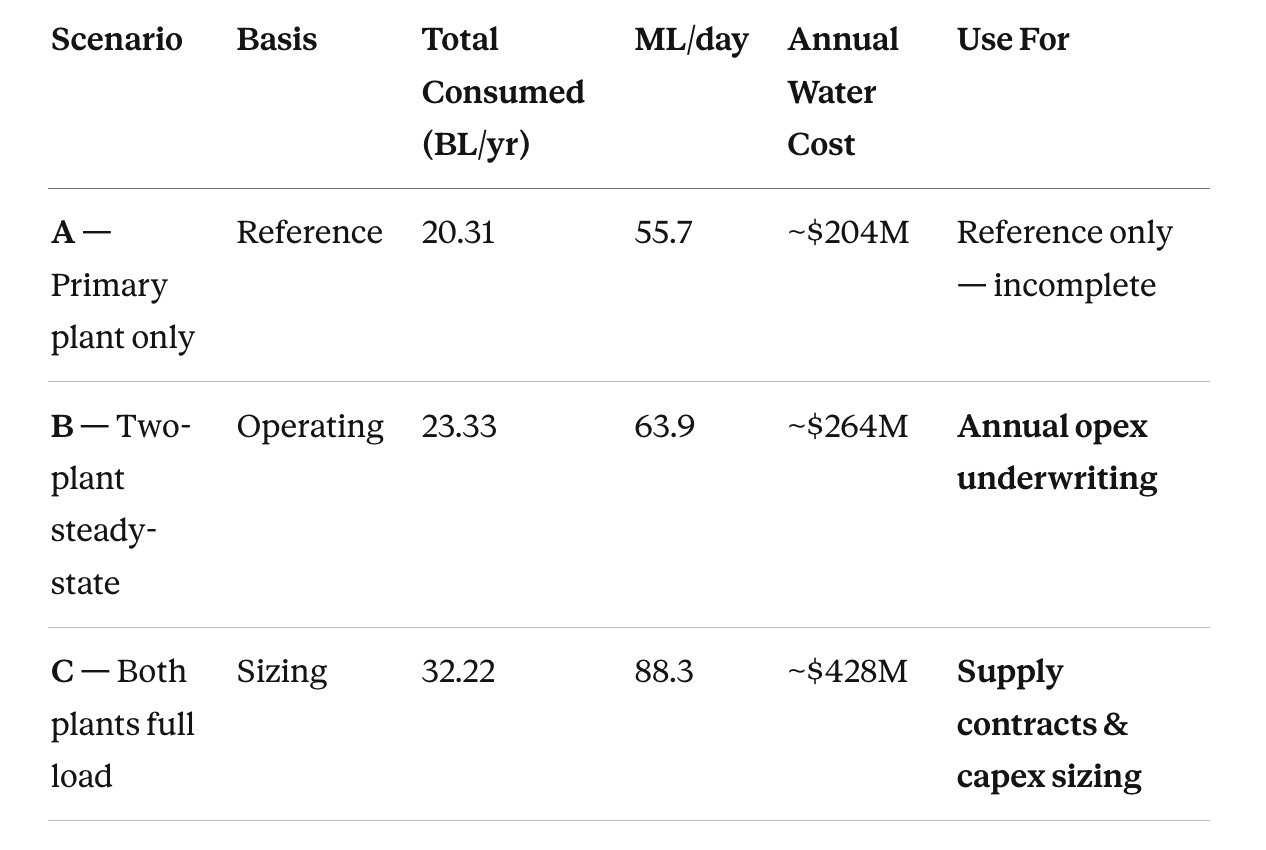
All figures use mid-tier DC cooling (WUE 1.2 L/kWh).
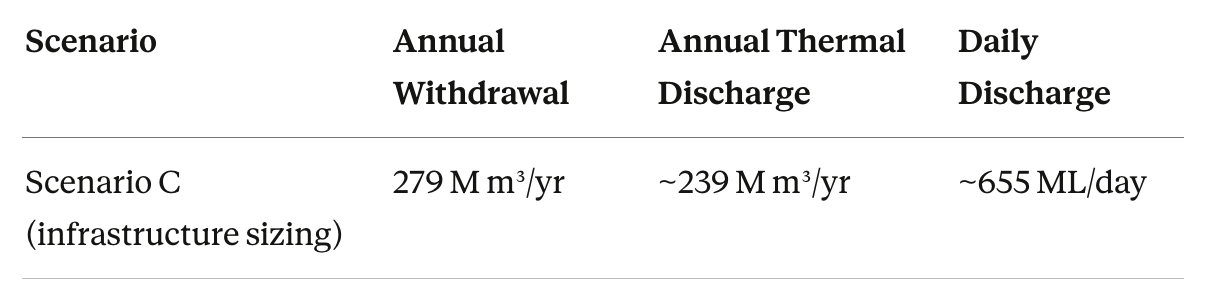
The distinction between B and C is meaningful. The water treatment plant, produced water pipeline agreements, and cooling tower capacity must all be sized for Scenario C, even if steady-state annual opex runs at Scenario B levels. Think of it as analogous to a power purchase agreement: you contract for capacity whether you use it or not. The supplier must be able to deliver the full volume on demand.
Total Integrated Model Across All Cooling Scenarios (Scenario B)
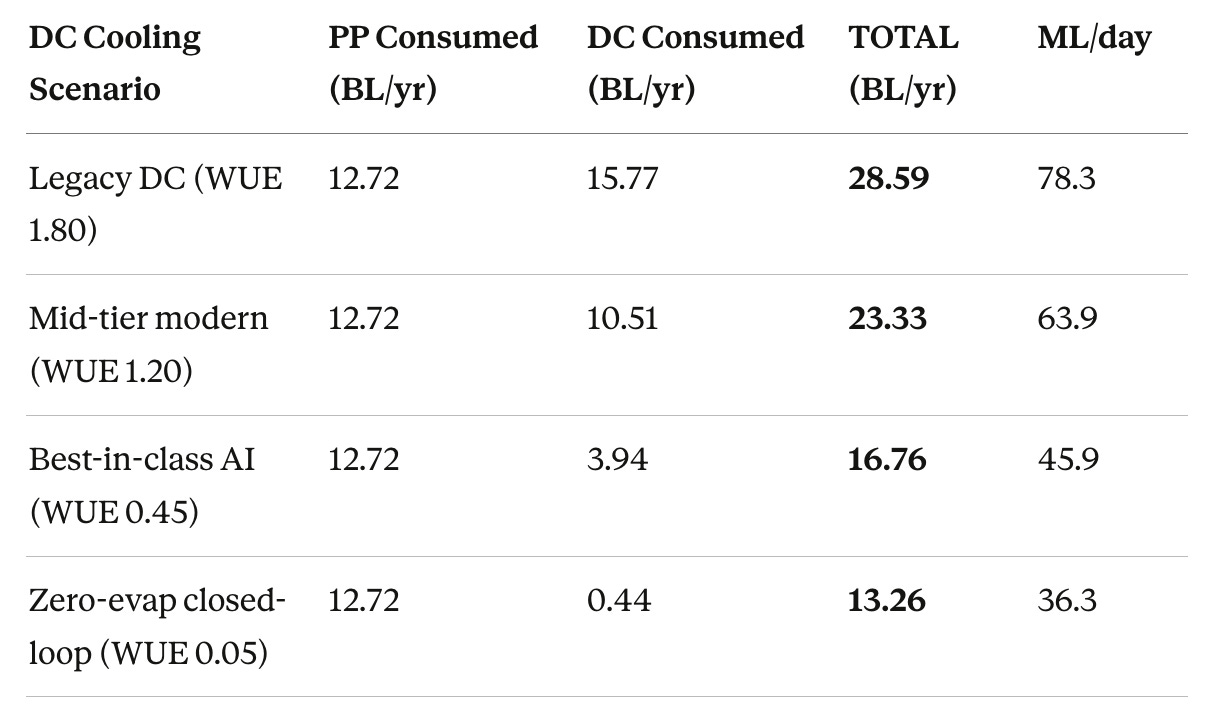
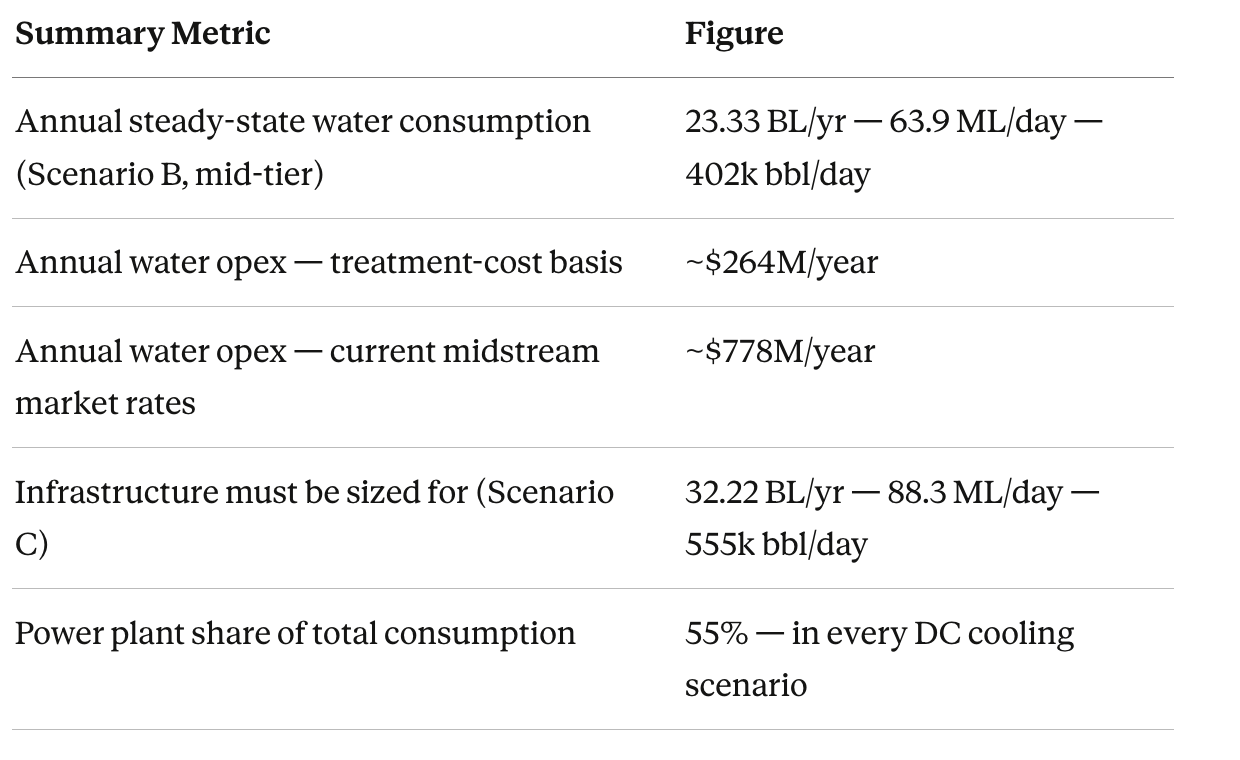
Even zero-evaporation data centre cooling still carries 12.72 BL/yr of power plant water consumption. The power plant dominates in every scenario and is unaffected by on-site cooling technology choices.
Permian Basin Barrels
It’s estimated that over 6 million BOE are produced in the Permian every day, alongside that emerge ~15 M BBL of toxic produced water.
With the context established, let’s put things into Barrel equivalents for our USA brethren.
Equivalents
For comparability with regional oil and gas water reporting. 1 barrel = 158.987 litres.
Part IV: Sourcing the Water
Freshwater Is Not a Solution
The Permian Basin cannot supply potable or freshwater at the volumes required. The numbers make this plain:
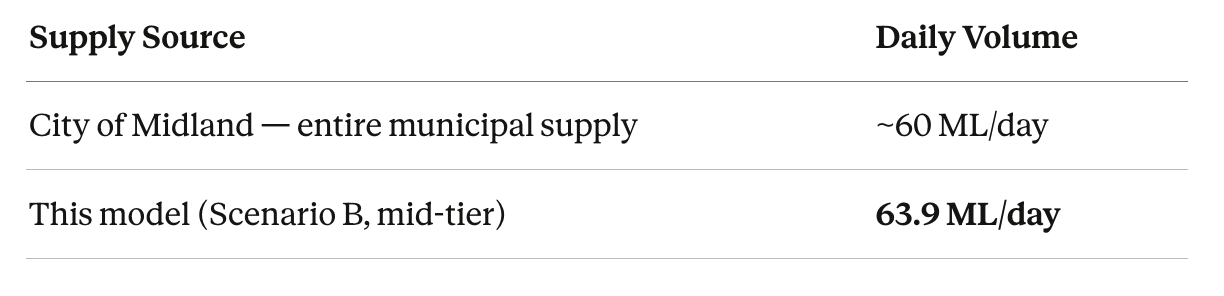
The model’s steady-state consumption exceeds Midland’s entire municipal water supply! Groundwater aquifers in the region as I understand are partially brackish and under severe multi-year depletion stress.
Produced Water: The Permian’s Structural Opportunity
The same basin that cannot supply freshwater produces approximately 15 million barrels (~2.4 billion litres) of co-produced water per day from oil and gas extraction — currently a disposal liability for operators.
The Texas Railroad Commission has been progressively restricting produced water injection permits in response to induced seismicity, a trend that accelerated following the appearance of a 160-foot geyser of toxic water in Toyah in December 2024, which gushed for weeks. This pressure is simultaneously closing off traditional disposal routes and building legislative momentum for beneficial industrial reuse.
The symbiosis is straightforward: data centre operators need water at scale; oil and gas operators need to dispose of water at scale. The Texas Produced Water Consortium is the primary body developing treatment protocols for industrial reuse, including data centre cooling.
Treatment Cost by Quality Grade
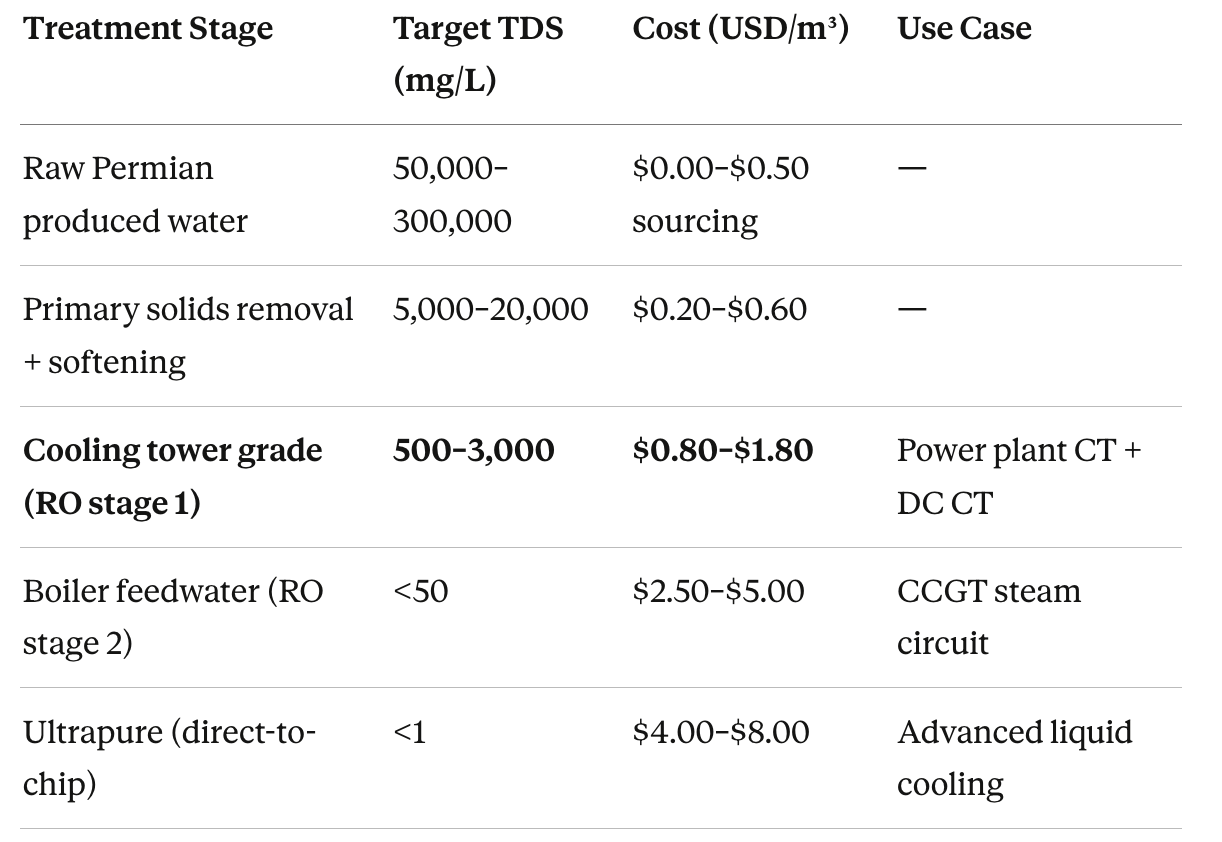
Annual Water Cost Model (Scenario B — Steady-State Opex)
Note: Costs applied to withdrawal volumes throughout, because sourcing, treatment, and pipeline infrastructure costs are incurred on all water entering the system, not only the fraction that evaporates.
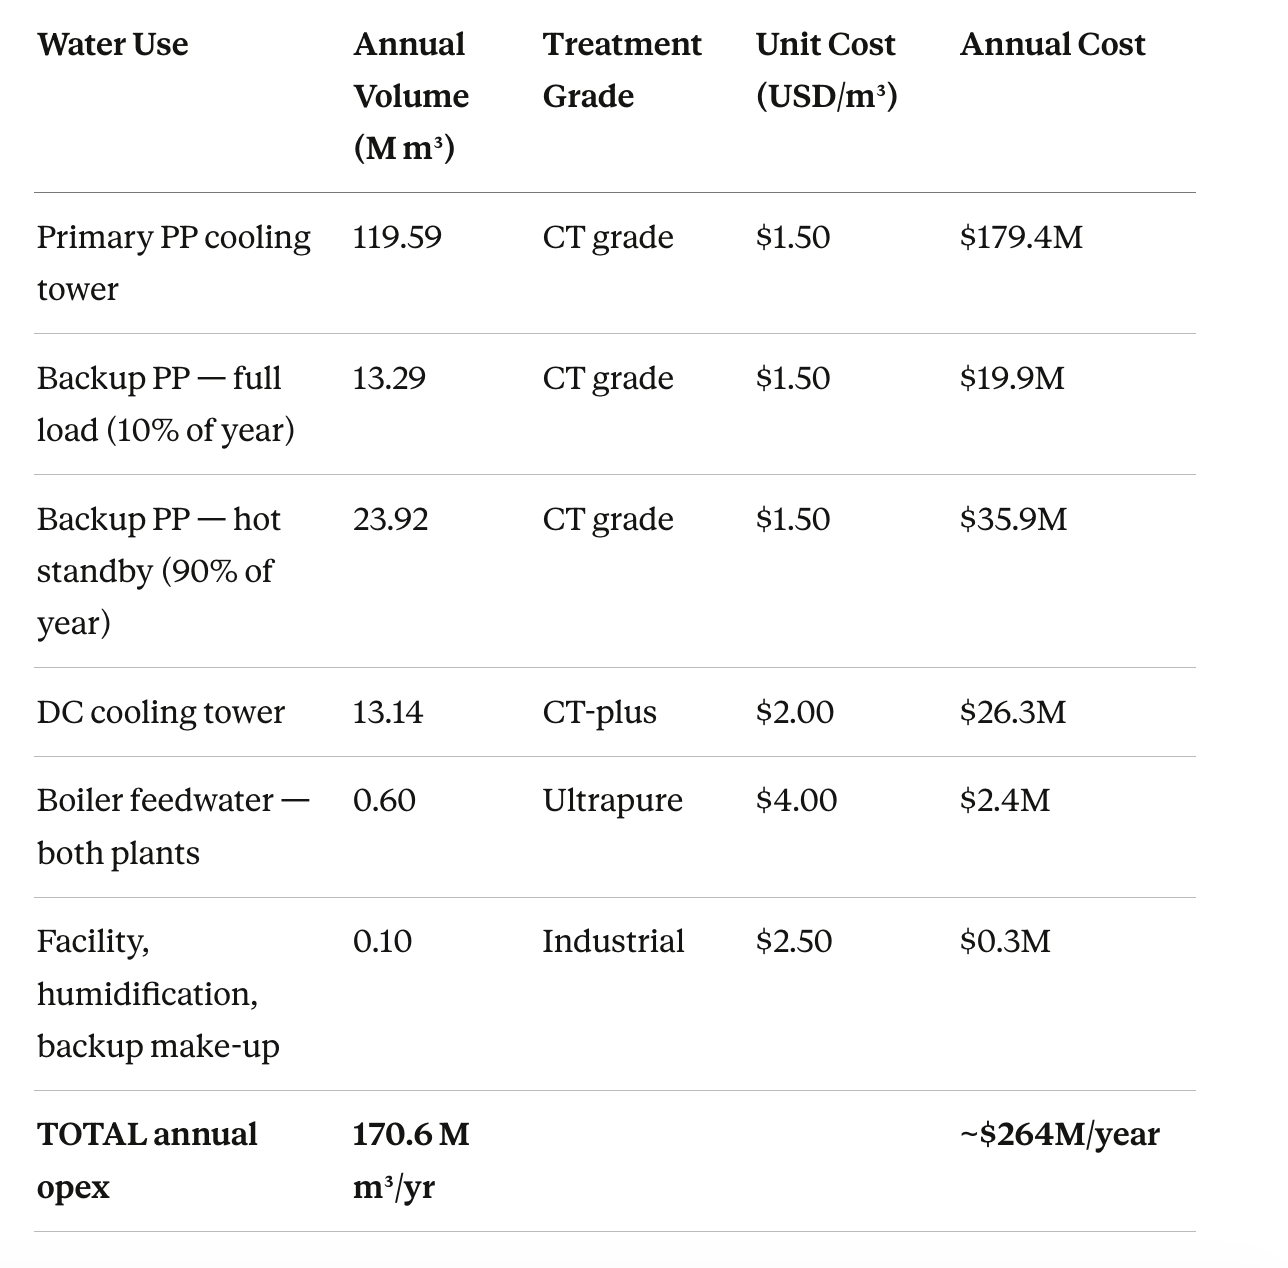
Total annual withdrawal of 170.6 million m³ equals approximately 2.94 million barrels per day. A campus paying the current integrated midstream market rate of ~$0.725/bbl (WaterBridge 10-K, March 2026) on the same volumes would face an annual water bill of approximately $778 million per year.
The $264M figure reflects treatment-cost-only assumptions ex-transport and delivery. The $778M figure is what the water supply chain currently charges. Both numbers belong in any serious investment model; neither is currently in most of them.
Part V: The Discharge Problem
This is a dimension of this analysis that is almost universally under-appreciated and I have found difficult to comprehend in terms of its numeric effect on water needs.
Water withdrawn must eventually go somewhere and account for changed in the solids concentration increasing as a result of the liquid lost through evaporation in the heating cooling cycle.
In an urban or coastal location, this discharge flows to a receiving waterway or municipal wastewater system. In the remote Permian Basin, neither option exists at this scale. The discharge must be treated and re-injected into the subsurface, or managed in large-scale evaporation ponds.
This discharge infrastructure is not being scoped in most project announcements this author has reviewed. Unfortunately, I am no better equipped to reach an investment conclusion, but believe it’s important to mention.
Part VI: Six Observations for the Investment Community
1. Freshwater scarcity is structural, not cyclical. There is no municipal water system in West Texas capable of supplying a 1 GW campus, and none will be constructed for this purpose. Any project that has not secured a long-term produced water supply agreement and on-site treatment infrastructure before financial close is not, in the strict sense, financeable. The underwriting community should require explicit evidence of water supply secured, not merely assumed.
2. Produced water regulation is moving in one direction. The Texas Railroad Commission’s tightening of injection well permits is proceeding in a single direction. Projects with treatment infrastructure are advantaged; those that assume disposal will remain available at current cost and volume are carrying regulatory exposure that may materialise on short notice.
3. The discharge problem is uncosted and underappreciated. 655 ML per day of thermal discharge in a remote location with no receiving waterway and restricted injection capacity is a major capex and permitting risk. It must be addressed at the feasibility stage, not deferred.
4. Infrastructure must be sized for peak, not average. The water treatment plant, produced water supply agreements, and cooling tower capacity must all be sized for Scenario C — both plants at full load — even though steady-state annual opex runs at Scenario B.
5. Water opex deserves its own line in the model. At ~$264M/year on the treatment-cost basis and potentially ~$778M/year at current midstream market rates. Water treatment and sourcing accounts for roughly 26–38% of power generation opex. That figure will likely rise as more projects compete for the same produced water supply and treatment capacity. Equity return assumptions that do not model a rising cost trajectory for water are carrying hidden risk/opportunity depending on buyer/seller.
6. Political pressure is accelerating. Texas does not yet require most data centres to report water usage. The Texas GOP has adopted a resolution demanding that the AI industry follow the same water management and recycling protocols required of oil and gas. The question for investors is not whether reporting requirements will tighten, but when, and what they will reveal when they do.
Conclusion
The investment community has spent considerable energy developing sophisticated views on the power constraint facing AI infrastructure. The power constraint is real. The water constraint is equally real, less well understood, and currently unpriced in this author’s opinion.
Produced water reuse in the Permian Basin is, at present, the only credible path to supply at this scale. The economics of that reuse are genuinely favourable today as operators pay for disposal, and data centres need water. That alignment will persist until enough treatment and delivery infrastructure exists to serve the full pipeline of announced projects. At that point, as with most infrastructure constraints that transition from ignored to recognised, the pricing will adjust in the usual direction.
© 2026 The Royalty King Research Report. Subscriber distribution only. Not for redistribution.
Data sources: US EIA Power Plant Operations Report; EESI Data Centers and Water Consumption (2024); Baker Institute for Public Policy, Rice University (August 2025); Lawrence Berkeley National Laboratory 2024 US Data Center Energy Usage Report; EU Climate Neutral Data Centre Pact; East Daley Analytics; Texas Campaign for the Environment; E&E News Permian Basin Water investigation (December 2025); Nixon Peabody AI Facilities Permitting (February 2026); Nature/npj Clean Water; IFC/World Bank Water Reuse; River Network Burning Our Rivers (2012); World Nuclear Association; MIT Energy Initiative Power Plant Water Use Working Paper (2012); DOE/NETL Power Plant Water Usage and Loss Study (2007). WaterBridge 10-K, March 2026.
The Landbridge invest day presentation left me with the idea that LB had a significant amount of water that was suitable for data centers at least up to a point. Produced waterbeds discussed but not emphasized at least at the current time. I could be mistaken, but it sure seemed that way. Did you read or see the event?