
WaterBridge Infrastructure: The Royalty Hidden in the Oilfield

One of the most anticipated events of this year for me was the IPO of Waterbridge WBI 0.00%↑ , the sister company of Landbridge, a company about which I have spilt much digital ink.
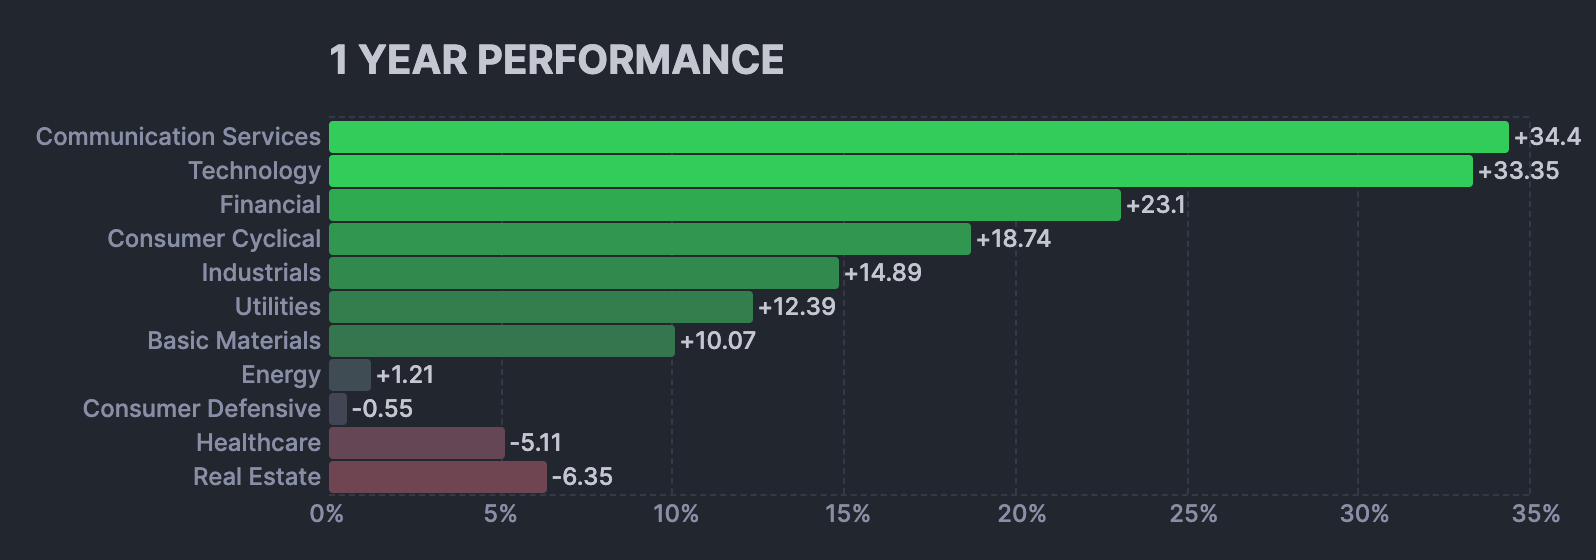
The energy sector has bored many this year, especially when compared to other sectors.
Yet the consensus (IEA et al) appears to be slowly back-peddling the prior dire predictions for global oil demand, conceding that the likely global demand reaches 110 Million BBLs per day by 2030.
In order to meet the growing supply the CAPEX spent on oil and gas production is estimated to grow at ~4% CAGR up to the end of this decade.
It is expected that a large amount of said CAPEX will be spent in the US Shale patch - home to many of my main investment positions and safely positioned away from the threat of tariffs and deeply embedded in what is still the world’s largest consumer economy (nominally).
But what if depressed oil prices continue longer than most expect and test the patience of investors (and balance sheets) of those service companies desperately waiting for an inflection point in this commodity cycle?
Again this is where I have learned to consider the underlying business model closely.
Most investors think of the oil and gas space very simplistically and superficially.
With so much noise made about barrels of crude, cubic feet of gas and their associated prices it’s understandable how they might miss the deeper economic connections the headline commodities have with related products involved in their extraction process. Yet behind every unit of production is an entire ecosystem of flows, costs, and byproducts that rarely receive attention.
It is one of those associated products that interests me far more than the hydrocarbon aspect. It is inextricably linked to shale oil and gas production and any growth in their extraction causes a 2-4x growth factor in the extraction of this derivative.
You might think of it as growth on growth when applied to oil and gas production.
One of the least glamorous, but most interesting commodities to me is produced water. It is the salty, hydrocarbon-laden water that comes to the surface of every well along with oil.
In the Delaware Basin, two to four barrels of water can accompany a single barrel of oil. This is not optional. If you want to pump oil, you must move and dispose of the water. That makes produced water handling a toll-booth business: volume must flow, regardless of the oil price on a given day.
The Core Idea: A Toll on the Byproduct
WaterBridge Infrastructure (WBI), another member of the Five Point Energy Private Equity Family, claims to be the largest produced water network in the U.S. In essence it is a midstream company, but for water.
Its current infrastructure footprint:
2,500 miles of pipe
197 facilities
Capacity over 4.5 million barrels per day
Current throughput around 2.6 million barrels per day
The model is straightforward. WBI charges operators a fixed fee, currently $0.70- $0.75 per barrel to gather, transport, recycle, and dispose of produced water. They also recover a de minimus amount of hydrocarbons via ‘skimming’ which contributes a small amount of extra revenue.
The contracts are long-term, fee-based, and escalate with inflation.
It is instructive to think of it as in a utility on the waste stream of the most prolific oilfield in the world as described below in my chat with PM James Davolos.
I’ve been told, including by many smart people I respect, that I am insane for buying some of these royalty-type businesses at what appear on the surface to be rich valuations.
Maybe I am.
Or perhaps taking a different view might shed light on what a cursory glance at the typical ‘screener’ metrics like PE ratios etc miss.
A big part of this is that screener simply scan for the reported accounting metrics which can be hugely misleading if you’re wearing ‘accounting blinkers’.
for eg:
On a GAAP net income basis, recent filings show net income margins of just 4–6% when positive, and at times even losses.
However these are not cash impairments.
Heavy depreciation charges on infrastructure, plus significant interest expense, compress the accounting bottom line.
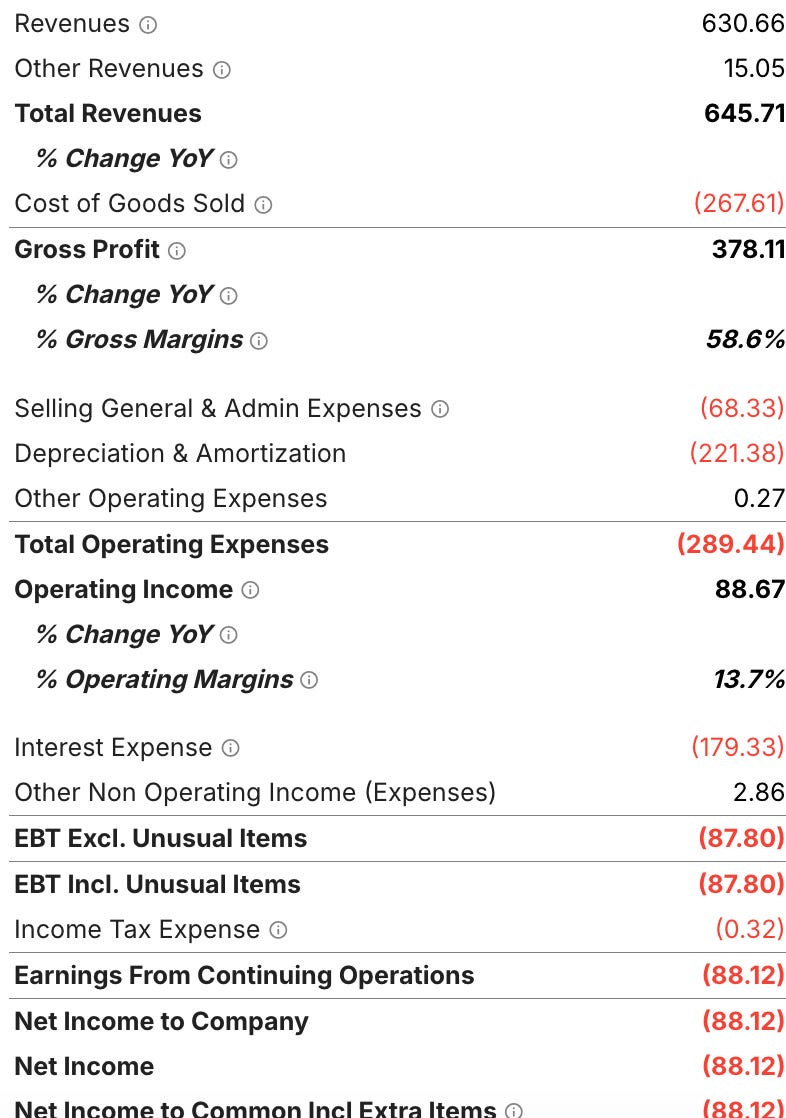
Let’s rewrite the above reporting on a cash basis, ignoring depreciation which is non-cash.
Revenues - COGS - SGA and interest expenses (which are cash expenses) shows the earnings before tax (EBT) is actually closer to $130.45 million.
Accounting for all shares, regardless of type, the IPO valued WBI at a $2.3 Billion MC suggesting just less than a 20x multiple.
But again, this short hand revision of its valuation misses the big picture of what this business model might deliver in the coming years.
So, allow me to offer a different perspective.
Scaling the Economics
At today’s throughput of ~2.6 MMBpd, WaterBridge cleared $630 million in revenue in 2024 prior to its IPO. If volumes climb toward nameplate capacity of ~4.5 MMBpd and fees hold near $0.75/bbl, revenue potential sits around $1.2 billion per year or ~60% of its current market cap.
At even a 20% operating margin, that equates to ~$240 million in operating cash implying a <10x multiple before considering growth.
Which begets the following thoughts:
The most common objection I’ve heard with regards to some of my royalty-type investments is the multiples quoted by the various software programs, which as I’ve shown above is rather misleading.
Water handling fees have grown at a CAGR of 7% across the region broadly historically yet new regulations are expected to raise handling rates 20-30% next year.
Viewed through GAAP income reported, the business looks marginal. Viewed through per-barrel cash margin, it looks like an annuity.
The disparity is stark. Which number is more indicative of underlying performance?
Through The Looking Glass: The Equity Yield Curve
I’ve always found the equity yield curve a helpful mental model in terms of gaining perspective on an investment’s true potential.
Today’s 2.6 MMBpd and $180 million in operating margin the market is blinded by the depreciation reported and hasn’t recognised the potential of the business model.
At full scale, they could be looking at $240 million+ over time as volumes fill out and the fees per bbl are raised without commensurate operating costs.
That is exactly how royalty businesses compound and why they are my preferred ‘long-long’. Early on, the apparent yield is modest. As production ramps and commodity prices rise, the effective yield on the original purchase price really rises. Investors who understand this dynamic focus less on today’s misleading GAAP margins and surface multiples and more on the trajectory of throughput and fee-per-barrel economics.
WBI has another advantage in that it has an enviable access to pore space or the underground formations that can accept injected water. WBI has preferential access through 277,000 acres of pore space rights, plus agreements covering 64,000 acres along the Texas-New Mexico border.
For operators in those zones needing reliable waste water disposal and piping capacity - who you gonna call?
Why Am I So Interested In Water?
No matter the oil price, if wells are flowing then the water must be moved and disposed. WBI have positioned themselves as the number one toll-booth on that bi-product stream.
At $2.3 billion, is this a 30× P/E stock or a utility-type waste disposal business in disguise trading at less than 10x future operating cash flow?
The answer depends on the profundity of your point of view and more so on your understanding of the underlying business model.
Waterbridge Is A Hidden Royalty Co.
The great opportunities in markets are often hidden in plain sight. Today, perhaps, one such opportunity is lying in the murky brine in Texas.
WaterBridge doesn’t have the current popularity of precious metal royalties. But its operating model does have similarities with those streamers who target certain deposits with byproducts that are less relevant to their producers and thus often overlooked by the market.
WBI holds an interest in managing an unavoidable stream of volumes governed by contracts, with embedded infrastructure tied to the most important shale region in the world.
If you look only at the surface-level metrics on your screen, you will miss it.
If you look deeper at the underlying business and trace out an equity yield curve, you might see the development of a new royalty-like asset class emerging through the economics of water in the oilfield.
In my next piece on Waterbridge I’ll attempt a valuation at what it might ultimately be worth one day if things play out the way I envisage.
Until then, take care - and do tell a friend about this ‘stack.
Benjamin

Disclaimer: This publication is intended solely for documenting my personal journey with trading and investments for income and travel purposes. I am not a certified financial advisor nor am I a financial professional and none of the content provided should be construed as investment advice. It is essential to conduct your own thorough research and consult a registered financial service provider for appropriate guidance. I cannot guarantee the accuracy or completeness of the information presented. Any actions taken based on the information shared in any of my work are done at your own risk and discretion.
Hi Ben. I think you missed cost of goods sold in your EBT calculation. They are $267mln, so EBT is actually $117mln ($630 revenues - $267 COGS - $68 SG&A - $179 Interest). It changes multiples by a lot. It's not anymore 6x EBT, but rather ~20x EBT.
Also, their CAPEX for 2024 was almost $190mn. Part of that is of course growth CAPEX, but part of that is maintenance for sure (they mention it in S-1), which reduces EBT even more. Let's say 30% of CAPEX is maintenance, then we have to subtract another $57mln. So EBT is 117-57=$60mln in the end (38x multiple and only 10% margin).
Ben , this is good. But I've a question which stop me , do you know if the water disposed was found leaking and damage the enviornment , who has the legal responsibility ? LB or WBI ?
I try to find this answer myself , but James also didn't mention it or it's just not important at all in your thesis ?