

In Proud partnership with The Solstice Laboratory — the physics of markets, quantified. Read The Entropy Trap to discover what physics knows the economics doesn’t.
Two variables have held in a range-bound ratio for eighty years. Not by decree, but rather by market or natural forces.
The ratio?
15 ≤ x ≤ 20
Let x = 1 oz of gold and 15 and 20 represent the equivalent of barrels of oil purchasable.
Whenever one side moves without the other, the system doesn’t break so much as store tension, which eventually must be released. The lens here isn’t so much policy or sentiment; it’s closer to physics. Gold is the proxy denominator for the true price of consumed goods and the end destination for ‘excess liquidity for storage’ (read inflation-protected savings). Its price is affected by sovereign debt expansion, Chinese money supply, the pressure building on fiat. Oil is downstream of that same liquidity, yet its end use is consumption and its supply is much more responsive in the short term to price changes. A question worth pondering is whether this ratio holds and reverts back to its historical range, or whether the much anticipated increase in fiat currency liquidity might be sharp enough to break the ratio this time, effectively forming a de facto new monetary system?
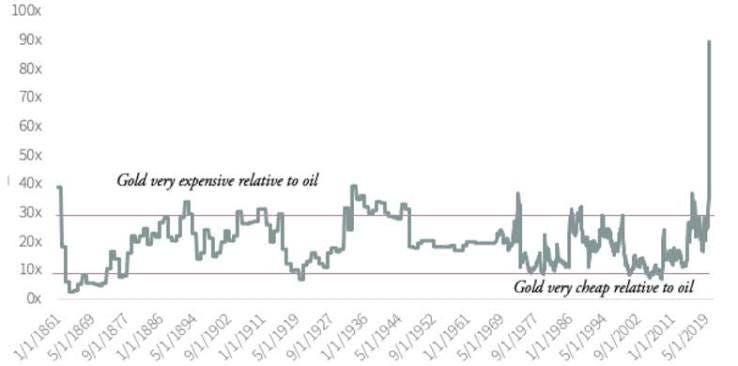
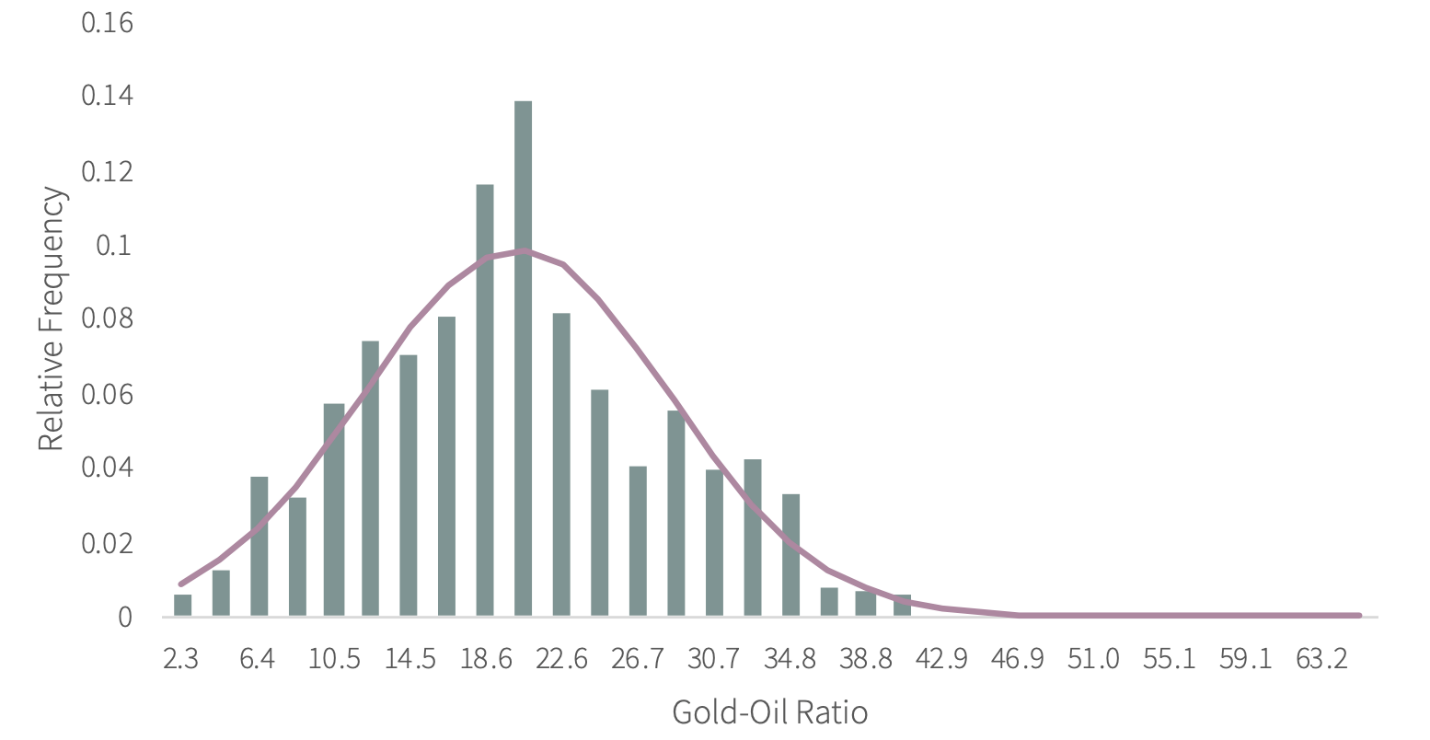
Let’s explore this idea, contemplating a range of likely gold prices first, understanding what that would require from a compounding perspective and then locate the resulting oil price needed for the ratio to hold.
I’ll begin conservatively and give the theme time to play out - say, end of decade- and work backwards.
A Gold Hypothesis
In this video I explored my range of price targets for gold (and become convinced that most commentators only ever read the headlines and not beyond!).
The point was less about the exact nominal price gold may reach, but much more about what that means for everything else in gold-adjusted terms.
Hypothesis: Gold is at least $7,500 USD per oz in 2030.
Two numbers to remember as a starting point: Gold printed a nominal all-time high of $5,589 an ounce in January 2026, then corrected hard, down some 28% to the low $4,000s.
THE MATH
What does $7,500 actually require?
From today’s price near $4,000, it needs roughly 12–13% compounded annually through 2031. While they may sound high coming off 40 yeaers of benign economic environment, in actuality it would merely be on par with gold bull runs during that period.
Yet from January’s $5,589 high, the compounded annual growth rate (CAGR) needed is a paltry to 6–7%, a rate slower than the pace sovereign debt is currently expanding. Measured against gold’s three prior bull markets, a 12% CAGR would be the most anaemic run ever — which seems unlikely given the fundamental drivers are the most bullish for gold they’ve been in recent history. Nothing about this base requires imagination. It requires the least extravagant bull market gold has ever run.
The Misconception
Whose liquidity is actually driving this, the dollar’s debasement or someone else’s?
Most commentators I hear talk about the US dollar’s debasement being the reason for gold’s bull run. I believe that will ultimately be true - but so far that particular guest is yet to even arrive at the party.
China conversely, is already seated at the table and is a few Aperols in, it has taken a water break since the Iran conflict began, and its drop in liquidity injection is speculated to be a tool to temper oil consumption during an uncertain time.
Chinese gold, has already roughly doubled with a domestic run that maps closely onto the $4,000-to-$7,500 move in dollar terms. China’s M2 sits near 354 trillion yuan or ~ $52 trillion USD equivalent, with an M2-to-GDP ratio more expansive than America’s.
Additionally, a domestic population that can’t buy Bitcoin and its real-estate savings vehicle having been rug-pulled by the CCP and the exit ramp for that liquidity points at one place. The yuan is more likely to weaken than strengthen over the window, which only adds fuel: a weaker yuan means Chinese buyers need more of it to buy the same gold, and the government has shown every sign of preferring that flow over the property market or capital flight.
THE OIL PROBLEM
Here’s the part not many are seriously considering.
If gold nearly doubles, what happens to the other side of the scale?
Does the ratio hold? In which case oil goes to $375-$500 per barrel.
Which boggles the mind when considering the ripple effects that would have on the rest of the world economy.
Or does it break?
Which means we’ve entered a de-facto new monetary system, just not the one everyone is talking about.
All the focus is on the gold: USD ratio, which is important, but nominal.
Gold : Oil represents true money’s ability to buy the most fundamentally essential input good in the modern economy.
This is the real stress test. Real (inflation-adjusted) oil is historically cheap. The 1980 peak of $36 a barrel is roughly $160 today; the 2008 peak is closer to $210. Current prices near $84 sit at about 40% of the 2008 real high and half of 1980’s. Even the shock of open conflict in the Middle East hasn’t pushed oil back to its inflation-adjusted highs.
All the aforementioned support the axiom that the real price of all consumer commodities is lower due to their stock:flow profile which is so misunderstood and under appreciated. I expanded on this point here in Compendium I

Now run the ratio: if gold reaches $7,500 while oil stays flat near $84, one ounce buys roughly 90 barrels — a ratio more extreme than COVID’s 85x, which was itself the most dislocated print in the modern data series, and was set in the moment a futures contract briefly traded negative. There is no historical precedent for that level of distortion becoming the norm in USD denominated terms.
However, consider that, while oil became a global commodity in the 1860s, for the majority of oil’s life as the world’s primary energy source (1950’s onwards) this has coincided with the USD being the global fiat reserve and post Bretton Woods, the monetary system has been the petrodollar standard.
Ergo, ipso-facto, should the historic ratio fail to mean-revert in the face of an un-offical gold revaluation of the USD — because that’s what $7,500 gold really means — it means the end of the petrodollar system.
POSITIONING
How do you own this without picking a side?
Royalties.
On both gold and oil.
It’s the only full-cycle, outcome agnostic way to gain alpha on either scenario.
Gold miners may skyrocket if the ratio breaks, oil producers and services should the ratio hold. But miners’ margins cannot remain if the ratio holds and oil catches up to gold and price-sensitive oil producers will suffer if the ratio breaks and their commodity continues to cheapen in real terms.
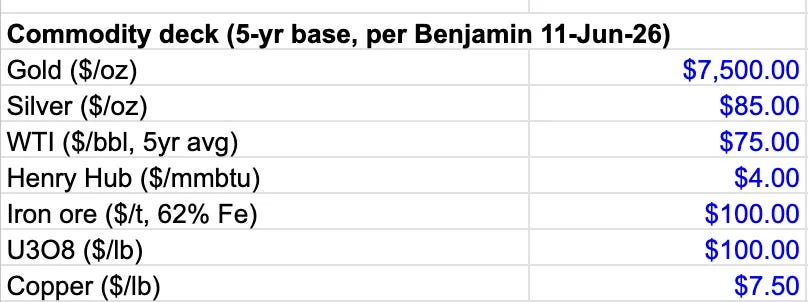
I’ve created a full valuation deck for the names I own and monitor whose valuations are updated in accordance to commodity price changes. If you’d like to know what my valuations for key stocks are under certain price scenarios - upgrade to premium today and send me a message.
THE RECAP
Gold to $7,500 by 2031 isn’t the bull case here, it’s the floor. It needs 12–13% annualized from today, half that from January’s high, and it reads as a near-certain double in either dollar or yuan terms. Oil almost has to keep some pace; the alternative — gold detaching entirely while oil sits still — asks the system to hold a state more extreme than COVID’s worst moment, indefinitely, with no measurement ever forcing a collapse. History says that’s not how equilibria behave and therefore anything else would signify a phase-transition in the underlying system.
This means the end of the old world order and the start of a new one.

Until next time.
Benjamin
SOURCES: Gold’s January 2026 nominal all-time high ($5,589/oz) and subsequent correction to the low-$4,000s; Tetragrammaton asset allocation framework, first underwritten September 2025, published to Substack June 2026. Chinese M2 and retail gold-per-gram pricing per domestic reporting. Real oil price comparisons (1980, 2008 peaks vs. current) inflation-adjusted from nominal historical prices. Gold-to-oil ratio, 80-year average and COVID-era 85x extreme, per historical commodity data. Solstice Laboratory, Letter No. 5, September 2025. Figures rounded; verify before citation.
DISCLAIMER: This piece is commentary and analysis for informational purposes only. It is not investment advice, nor an offer or solicitation to buy or sell any security or asset. It reflects one person’s opinion and underwriting judgment, not guarantees. Seek advice specific to your own circumstances.
That was excellent, thank you.